AFT Blog
A Triple Choke Example: Why Getting Choked Flow Right Matters
With the release of AFT Arrow 6 last month, this month I am going to depart from my usual monthly high level focus and instead get more detailed technically on compressible pipe flow. I am going to revive a topic from 1996 where we built a "Triple Choke" steam flow model in AFT Arrow 1.0. This model is discussed in our AFT Arrow training seminars, so those of you have attended one of these will have seen it. It also has been part of the AFT Arrow Help system documentation since at least 1999.
There are three geometric situations which can lead to sonic choking and the Triple Choke example discussed here demonstrates each of the three. This technical paper I wrote explains the three sonic choking geometries in more detail.
One interesting back story to this example is that soon after we put it together in 1996 a company called inquiring about AFT Arrow. They had an application they needed to model that involved steam flow with multiple choking points. When we sent them this example they told us "that is exactly what we are trying to model!". They bought two licenses.
First I will explain the example. Second I will explain the calculated results. Third I will explain why obtaining those results is so difficult (and why, as far as we are aware, AFT Arrow is the only available software capable of modeling this). And finally I will explain all the important engineering information obtained from this model that an engineer needs to make sure the system will operate safely and properly.
1. Explanation of Model
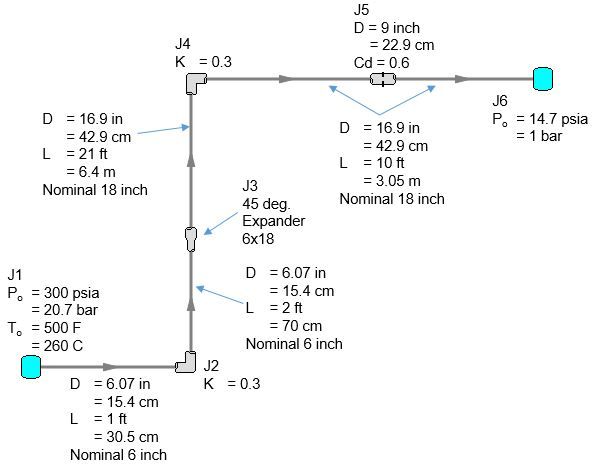
Figure 1 below is a diagram of the system and input data. The model takes superheated steam at 300 psia (20.7 bar) and 500 F (260C) - see J1 - and flows into a 6 inch pipe which expands to an 18 inch pipe (see J3). It then goes through an orifice restriction (see J5) before dropping to atmospheric pressure (J6).
Figure 1. Input schematic and data for Triple Choke Steam Flow model
2. Explanation of Calculated Results
The system has three choking points at J3, J5 and J6. The first choking point at J3 controls the flow rate through the piping while the choke points at J5 and J6 control the pressure distribution downstream of the first choke point at J3.
Calculating the choked flow rate at J3 is actually quite difficult even for a simple adiabatic flow situation. If heat transfer is included it is even more difficult. This will be discussed further in section 3. While AFT Arrow is capable of modeling heat transfer in all of the pipes, this example is focused on adiabatic flow.
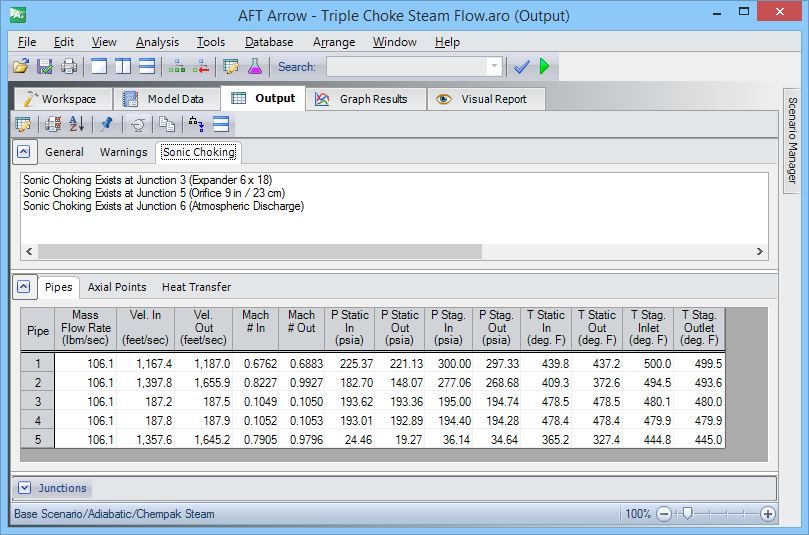
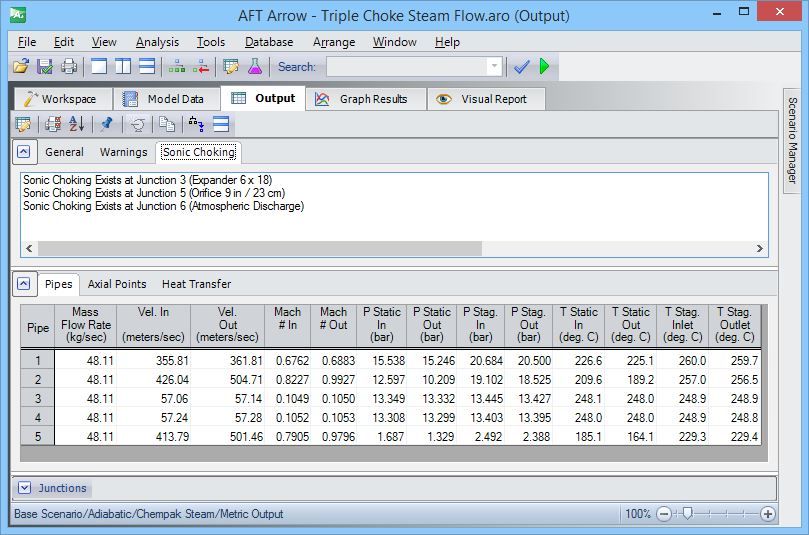
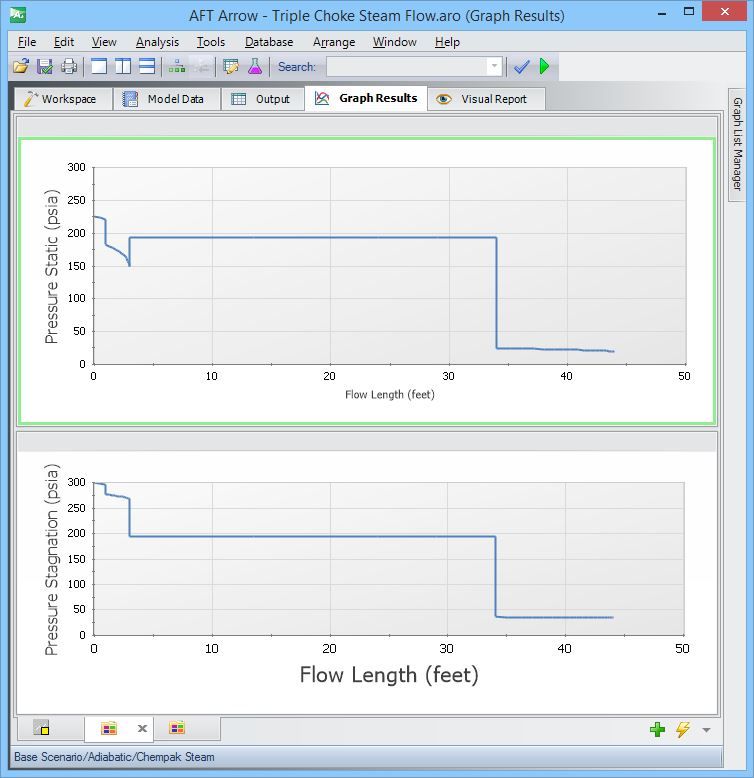
Figure 2 shows the AFT Arrow 6 output including the identification of the three choking points. The flow rate is predicted to be 106 lbm/sec (48 kg/sec). See Figure 2. Figures 3a and 3b shows some of the graphed results in English and metric units.
Figure 2. AFT Arrow Output for Triple Choke Steam Flow model (English units top, metric bottom)
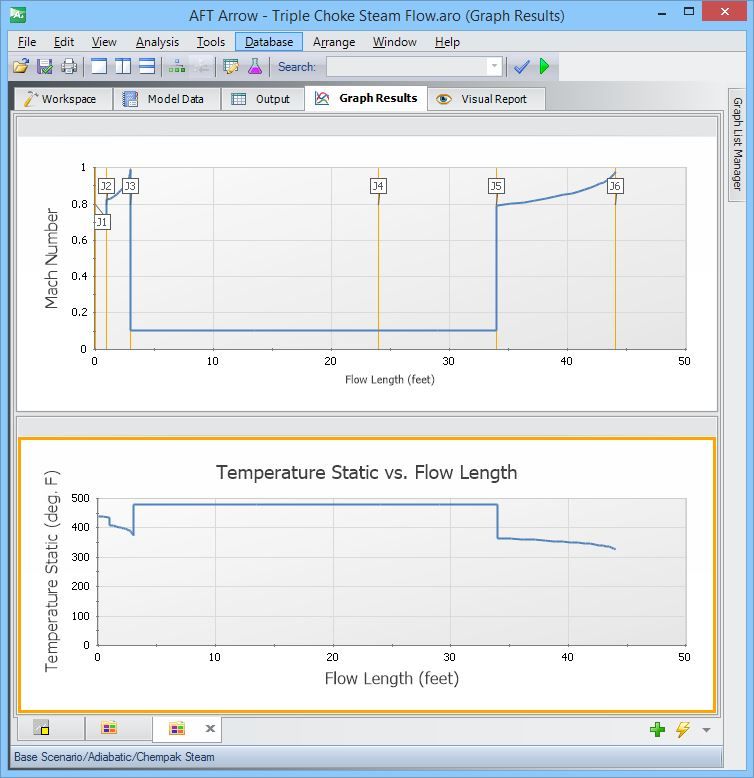
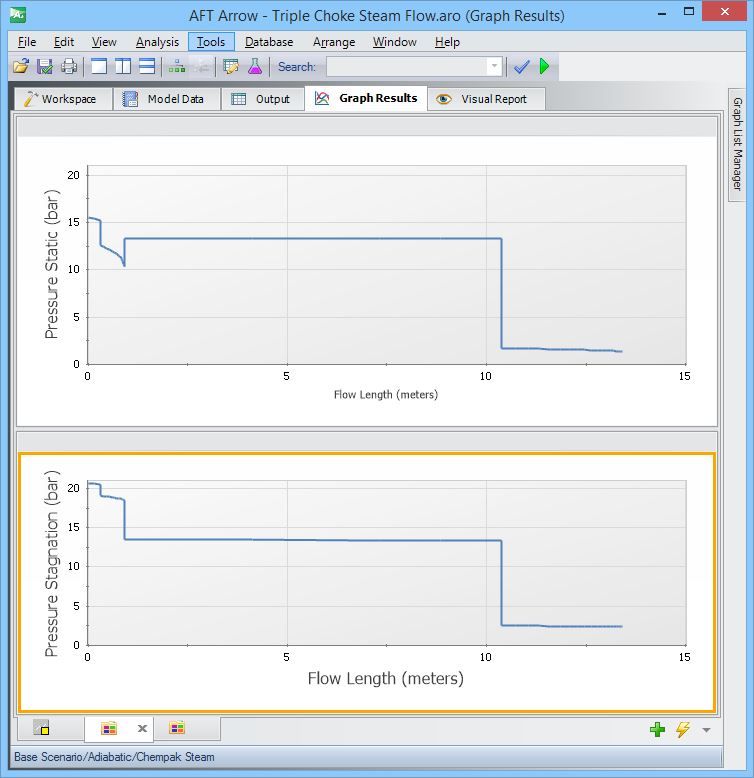
Figure 3a. Static and stagnation pressure profiles (top), Mach number and static temperature profiles (bottom) in English units
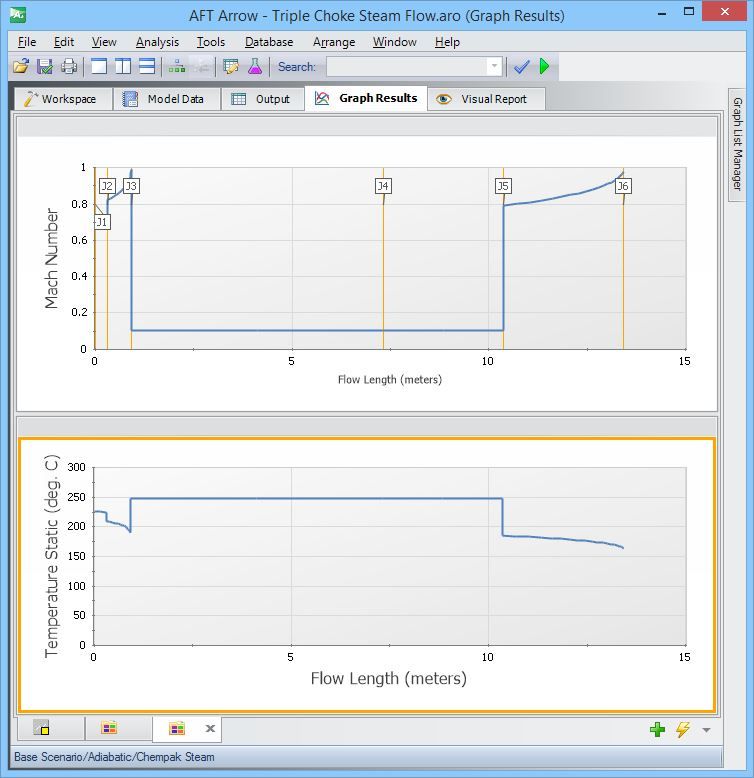
Figure 3b. Static and stagnation pressure profiles (top), Mach number and static temperature profiles (bottom) in Metric units
3. Difficulty Predicting Results for Triple Choke Steam Flow Model
The first calculation difficulty for this model is actually the easiest to calculate, relatively speaking. It is the choked flow rate. The choked flow rate is governed by the choke point at junction J3 (Figure 3). The difficulty is that thermodynamic conditions at J3 are required to determine the choked flow rate of 106 lbm/sec (48 kg/sec). However, to know those conditions one has to know the flow rate. This is a chicken and egg quandary. Most other software that claims to do compressible pipe flow cheats and uses the supply conditions at J1 and assumes minimal pressure drop between the supply J1 and the J3 choke point. AFT Arrow uses proprietary, iterative algorithms developed for AFT Arrow 1.0 in 1995-1996 to determine the correct choked flow rate along with the corresponding correct pressure drop and temperature change from J1 to J3.
Once the choked flow rate is established, the pressure drop across the J3, J5 and J6 choke points needs to be calculated. This is particularly difficult because the only pressure known downstream of the J3 junction is the atmospheric pressure at J6. But there are three choke points in between junctions J3 and J6. This difficulty was solved in the same AFT Arrow 1.0 where proprietary, iterative algorithms are used to determine the pressure distribution - as well as temperature, density and velocity (or Mach number) profiles (see Figures 3a-b for these distribution profiles). The key to these algorithms is the rigorous application of mass, momentum and energy balances along the pipe system along with special, creative iteration techniques.
4. Important Engineering Information From This Calculation
Some engineers naively say "once you determine the choked flow rate, who cares what happens downstream of the choke point?". The answer is that many engineers care for a variety of reasons. Some are listed here:
- Safe pressure operation - the pressure downstream of the J3 choke point is needed to make sure proper wall thickness is used so that the pipe is strong enough to handle the pressure
- Safe temperature operation - the temperature on the pipe surface (or insulation surface, if insulation is used) downstream of the J3 choke point is needed to ensure it is safe for human operators and to comply with occupational safety requirements.
- Safe acoustic operation - locations with acoustic requirements need to know the gas velocity and thermodynamic properties downstream of the J3 choke point.
- Avoiding condensation - most gas applications attempt to avoid condensation and the uncertainties that come along with that. The engineer needs accurate pressure and temperature conditions downstream of the J3 choke point to make sure no condensation is occurring.
Sonic choking can get quite involved and having a tool which is up to the task is important. AFT Arrow has proven itself repeatedly over the last 20 years on challenging choked flow applications.



Comments 2
It would be helpful to comment on how much the stated solution deviates from one solved for precisely Ma = 1. Specifically, the results table does not show Ma=1 at the three points. I assume the mass flow is slightly impacted, but how does the pressure, temperature profiles downstream deviate?
Also, is the program using ideal or actual specific heat ratio and is it selectable? I know API 520(521?) recommends using the ideal so that sizing relief valves and the tail lines are conservative
A bit delayed answer - sorry - but we have found that converging exactly on M = 1 is very difficult during iterations - largely because the change in flow rate is so small between iterations. We therefore converge on M values of >= 0.99 for sonic flow and have never seen a significant different from the M = 1 solution. Thus the pressure and temperature profiles are not impacted significantly. Users can check this, for example, and we have done so ourselves by comparing AFT Arrow results to closed form solutions for adiabatic flow that have exactly M = 1 at the choke points. I have never seen a difference in pressures or temperatures than more than say a psi (7 kPa) or 2 degrees F (1 degree C).
AFT Arrow uses actual specific heat ratios but the user can enter their own values if they prefer.