AFT Blog
Feeling Compressed? Don’t Forget Your Thermodynamics
When dealing with a compressible gas system, heat transfer and thermal effects are very important to account for. When a gas is flowing down a pipeline, it will cool down as the gas expands due to the frictional pressure drop. Many would say that adiabatic or isothermal conditions will bracket the potential flow rates that are possible for a constant pressure drop in a pipe. However, this is not the case. If a gas is cooled or heated as it flows down the pipeline, the flow rates that can result for a given pressure drop can actually be outside the “bounds” of adiabatic or isothermal flow. Further details on this are discussed in the article “Gas Flow Calculations: Don’t Choke” which can be found here, https://www.aft.com/documents/AFT-CE-Gasflow-Reprint.pdf.
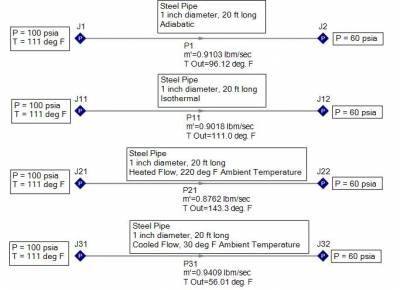
Consider air supplied at 100 psia and 111 deg F through a one inch diameter, 20 foot long, steel pipe and discharging at 60 psia. Four processes are examined for the following flow cases: adiabatic, isothermal, heated flow, and cooled flow. Based upon the resulting flow rates shown in Figure 1, the largest and smallest mass flow rates are NOT the adiabatic or isothermal cases! Cooling the gas will result in the largest mass flow rate (0.941 lbm/sec) and lowest exit temperature (56 deg F) while heating the gas results in the smallest mass flow rate (0.876 lbm/sec) and highest exit temperature (143 deg F).
Figure 1 - Air supplied at 100 psia, 111 deg. F, flowing through a one inch diameter, 20 ft long steel pipe. Adiabatic, isothermal, heated, and cooled flow processes are examined.
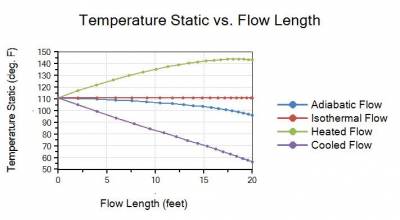
The four temperature profiles in Figure 2 also show that assuming an adiabatic or isothermal flow process clearly do not bracket the maximum and minimum temperatures that can occur.
Figure 2 - Static Temperature vs. flow length profile plots for adiabatic, isothermal, heated, and cooled flow cases. Maximum temperatures occur for heated flow case while minimum temperatures occur in cooled flow case.
The key point to realize for this example is that except for the isothermal flow case, the gas will cool down with a decreasing temperature along a pipeline for all cases as the gas expands due to pressure drop. The temperature does initially rise for the heated flow case, but it eventually begins to decrease and the gas will start to cool off again.
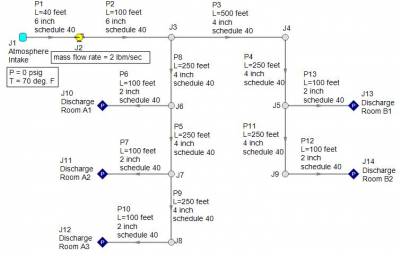
A compression process is different. In a compression process, the gas will heat up and will be accompanied by a rise in temperature. Consider the system in Figure 3 where atmospheric air at 70 deg. F is compressed through a system and discharges into atmospheric conditions at each discharge point. The compressor will provide a flow rate of 2 lbm/sec through the system. As air is compressed, the air temperature will rise and the temperature rise across the compressor should be monitored.
Figure 3 - Atmospheric air at 70 deg. F is compressed through the given piping system at 2 lbm/sec. Compressor temperature rise is of concern for adiabatic and non-adiabatic compression processes.
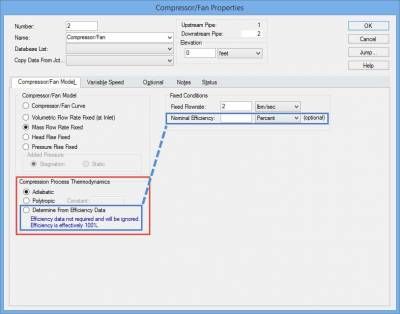
This is where it is important to take into account the Compression Process Thermodynamics of the fan or compressor and AFT Arrow will account for this properly. The Compression Process Thermodynamics can be accounted for in AFT Arrow for a fan or compressor in one of three ways, as shown in Figure 4: Adiabatic, User Specified Polytropic Constant, or to Determine From Efficiency Data. The air system in figure 3 will examine four cases in which the Compression Process Thermodynamics is taken into account: 1) Adiabatic, 2) 80% efficiency, 3) 60% efficiency, and 4) 60% efficiency with convective heat transfer for pipes.
Figure 4 - Compression Process Thermodynamics for fans and compressors can be taken into account by specifying an adiabatic compression process, a polytropic constant, or from efficiency data.
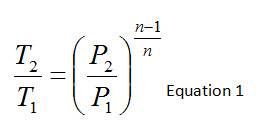
Available in a thermodynamics textbook, one can find the relationship between temperature, pressure, and specific heat ratio (or polytropic constant) which would allow prediction of outlet temperature or pressure for an adiabatic compression process. This is provided below where the temperatures and pressures are the static temperatures and pressures at the inlet and outlet of the compressor while n is the polytropic constant.
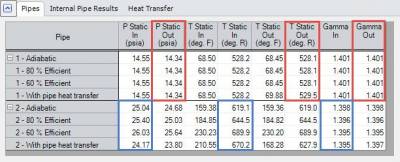
Back to the compressed air system that is being examined to predict the outlet temperature of the compressor based upon Compression Process Thermodynamics, the results for the four cases are given in Table 1 below.
Table 1 - Compressed Air System results in AFT Arrow at compressor inlet (P1) and outlet (P2).
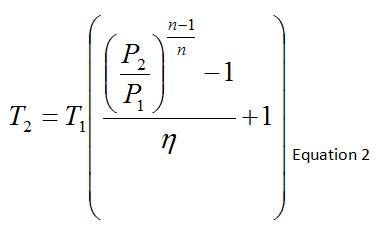
Because we are comparing the temperature rise across a compressor for adiabatic and non-adiabatic processes, the efficiency of the compressor needs to be accounted for as well, which is given by the relationship below. For an adiabatic process (such as the Adiabatic scenario that is modeled), the efficiency is equal to 1.
Table 2 contains the compressor outlet temperature calculation via Equation 2, based upon the absolute static pressures and temperatures, average of the compressor inlet and outlet polytropic constant, and efficiency. In the absence of heat losses from the pipes themselves, the compressor outlet temperature will increase as the compressor efficiency decreases.
Table 2 - Manual compressor outlet temperature calculation based upon static/absolute temperatures, pressures, efficiency, and average compressor polytropic constant.
Overall, this article is intended to show that heat transfer is very important to take into account for compressible flow and that the thermal effects for expansion and compression processes can be quite significant.




Comments 1
Hi in paper Gas-flow Calculations: Don't Choke by Trey Walters formula (11b) has f L /D = ... Should it be 4 f L/D =....
In some textbooks this coefficient 4 is included. What is used in Arrow?