AFT Blog
Amongst the vast multitude of superbly efficient features within AFT Software, the customization and Database capabilities are certainly of significant importance. If you are not familiar with how to use the Databases within our software to manage your customized information, then getting familiar should be a top priority for what you learn how to do next in our software. Making effective use of Databases will save you and your team of AFT users incredible amounts of time! The vast amounts of data that you can customize within our software includes: Components (junctions)Fluid propertiesPipe materialsPipe insulationFittings & Losses (that get lumped into...
With the release of AFT Arrow 6 last month, this month I am going to depart from my usual monthly high level focus and instead get more detailed technically on compressible pipe flow. I am going to revive a topic from 1996 where we built a "Triple Choke" steam flow model in AFT Arrow 1.0. This model is discussed in our AFT Arrow training seminars, so those of you have attended one of these will have seen it. It also has been part of the AFT Arrow Help system documentation since at least 1999.
Often times when building larger network models, you may not be sure what the direction of the flow will be and running the model is the only way to determine the flow direction. In the below AFT Arrow model it might be hard to determine what way the flow convention is in some of the loops. After running this model there are cautions stating that flow is negative through junctions that may have loss factors that are dependent upon direction. What is the easiest way to fix this? You could compare your results, remember or make a table of what pipes...
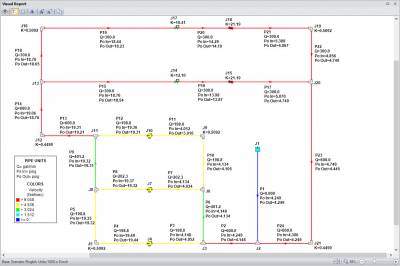
Each AFT software product employs five Primary Window tabs in which you would build, define, and analyze the model of your system. Of these, the Visual Report window is incredibly useful in that you are able to overlay your model input or output parameters directly on top of the graphical layout of the system itself. This is an excellent feature to use when you want to provide the bottom line results to clients and colleagues at a high level (or a detailed level). Figure 1 is an example of what the Visual Report for a particular system might look like. As...
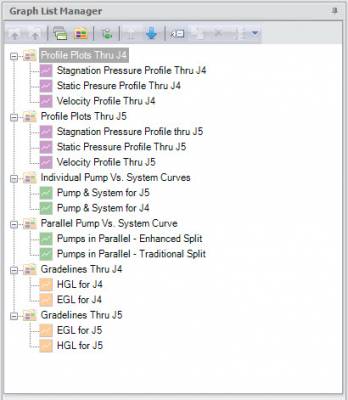
AFT software products have had powerful graphing capabilities for a very long time. Many types of graphs can be created with AFT products such as pump vs. system curves, profile plots along a flow path, gradelines and elevation profiles, transient plots (with AFT Impulse or the AFT Fathom XTS module), slurry system curves (with AFT Fathom SSL or AFT Impulse SSL modules), and selected solutions that allow you to plot various output parameters for desired pipes. All of these graphing capabilities are incredibly important to engineers as they analyze the hydraulic behavior of their system. The ability to customize the graphs...
When I started AFT back in 1994 I had the idea to develop a product for compressible flow in pipe systems. After AFT Fathom 1.0 was released in April 1994 I began research on numerical methods for compressible flow in pipe networks. Books and papers that claimed to offer methods for compressible flow inevitably focused on single pipe applications with adiabatic or isothermal flow - and often with ideal gases. I wanted to develop a real gas software that could model heat transfer and simulate pipe networks.
Mismatched fluid handling machinery and the systems they service are a frequent occurrence in industrial, municipal and commercial fluid transfer installations. And, as I found out this morning, in residential installations. Specifically, in the residential installation in which I personally live.


