


AFT Blog
Welcome to the Applied Flow Technology Blog where you will find the latest news and training on how to use AFT Fathom, AFT Arrow, AFT Impulse, AFT xStream and other AFT software products.
4 minutes reading time
(821 words)
Quick Guide to Custom Output
You've built a model, verified all of the inputs, and now you have results, but how are you going to organize and present these results? Here is a quick guide to some of the customization available in AFT software for displaying output and exporting your data using the Output, Visual Report, and Graph Results windows. The screenshots and examples for this blog all come from AFT Fathom, but note that all of the tips here apply to AFT Arrow, AFT Impulse, and AFT xStream as well.
Output Control
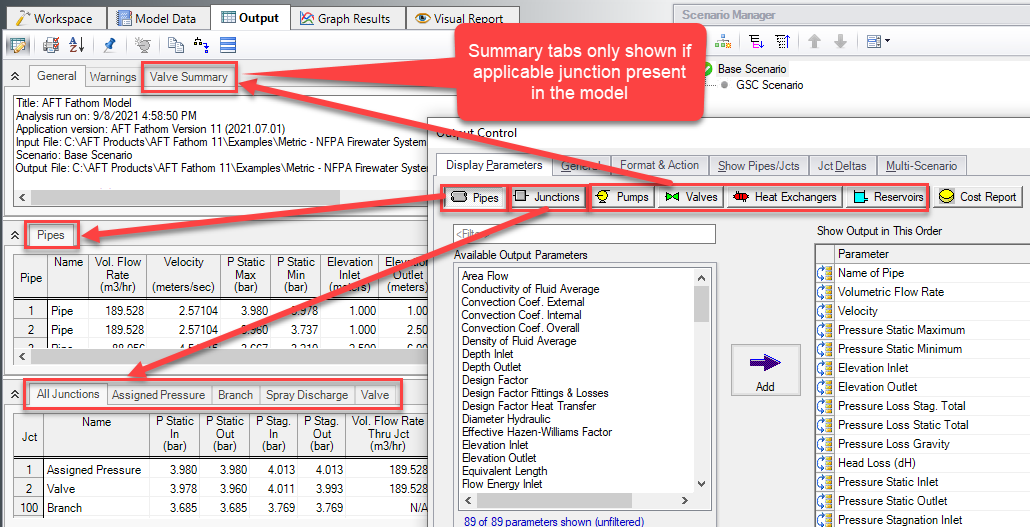
The tabulated results in the Output window can be customized from the Output Control window, accessed from the Toolbar or the Tools menu. The buttons along the top of the window correlate to the various sections of the Output window as shown below.
You can search for and add parameters to the output window by using the filter bar above the list to narrow down the selections, then double clicking the parameter you want to add:
Once you have the parameters you want, drag the parameters to change the order they will be displayed in:
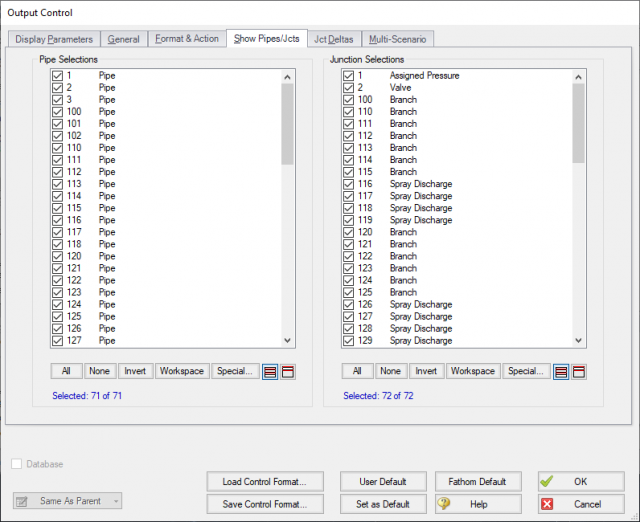
Besides parameters you can also customize what pipes/junctions will be shown from the "Show Pipes/Jcts" tab:
Exporting from the Output Window
Once you have the Output customized as desired there are a few ways to export the data.
For this option, first choose the data and formatting you want to include in the pdf by navigating to Tools > Output Print Content. Once you have the desired settings selected simply browse to File > Print Preview to directly print to pdf. Note you have to be in the Output window for the Output Print Content option to be available.
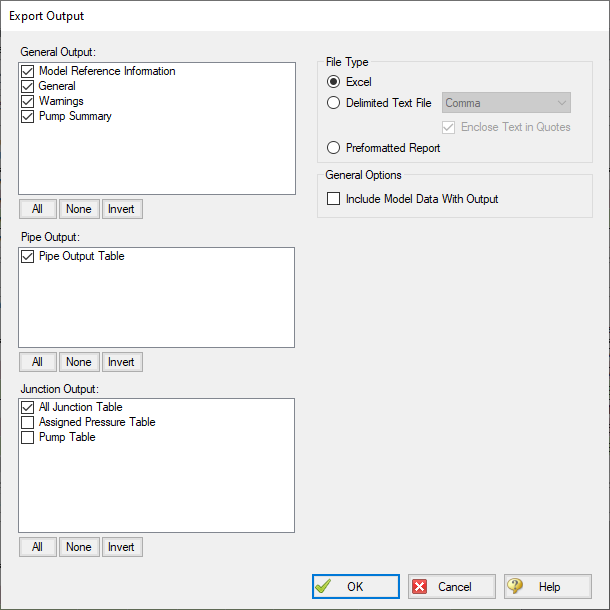
If you want to export all of your output data with no custom formatting, choose File > Export Output. This is the fastest excel export option, but provides minimal customization options for the spreadsheet as can be seen below. To build a customized excel export try using the Excel Export Manager, opened from the file menu or Toolbar. Check-out this blog which gives a run-down of how to use the Excel Export Manager.
Making a Visual Report
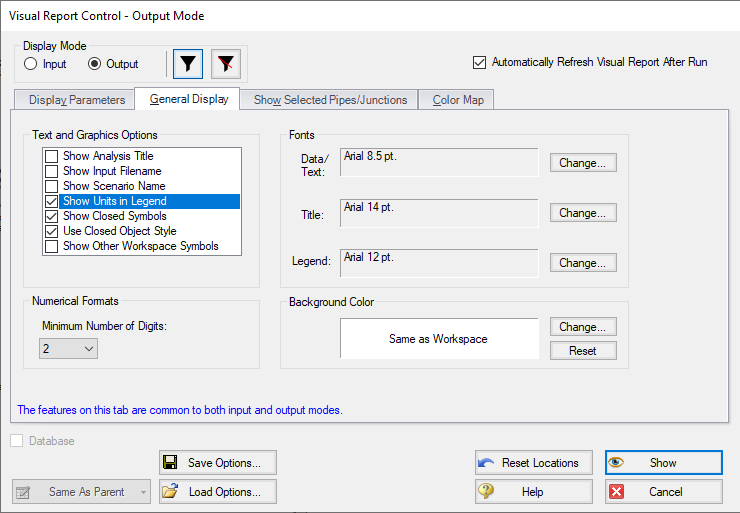
The Visual Report window lets users view results overlaid on the model. Similar to the output window Visual Report Control can be used to customize the parameters, pipes and junctions shown on the report from the Display Parameters tab. The General Display tab contains useful settings to clean up the appearance of the Visual Report such as displaying units in a separate legend and defining the number of digits after the decimal.
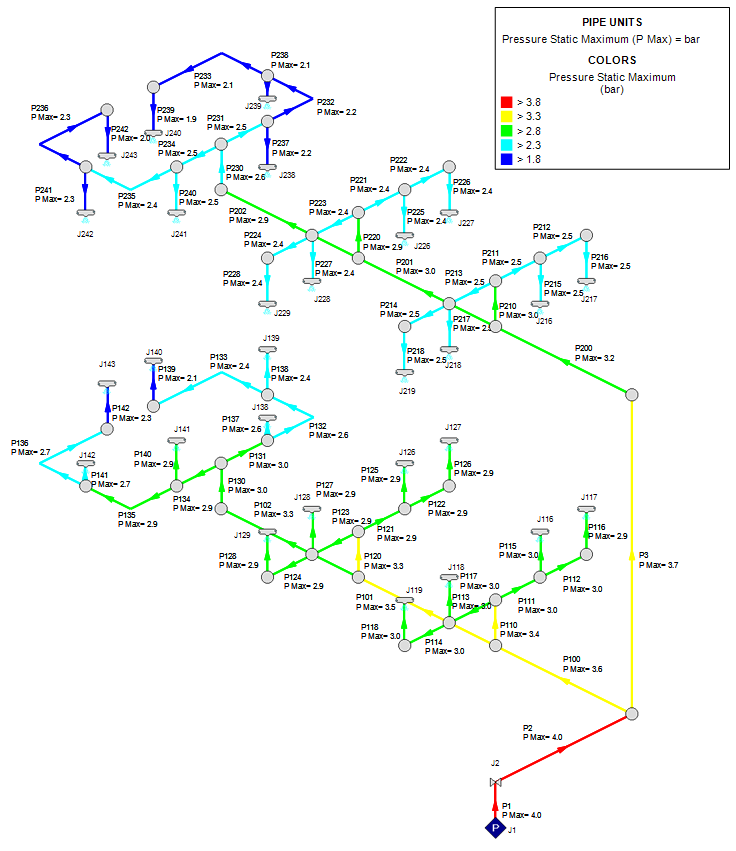
Besides customizing the information shown on the Visual Report it is also possible to create a color map to display the results qualitatively, as shown below. This can be done quickly using the "Automatic" option, but it is also possible to define your own ranges for each color. Simply select the parameter to use for the map, then click generate to define the minimum requirements.
The Visual Report can be printed to pdf from the File menu in the same way discussed for the Output window. To get the best results it is recommended to use a pdf driver such as Adobe pdf. Using a larger page size will also help to improve the pdf quality.
Graphing Results
AFT software offers a variety of different graph types to display simulation results. Creating a simple graph is easy to do from the Workspace - Just select the object(s) that you want to graph results from, right-click the Workspace, then browse to the result you want to graph in the pop-out menu like the example shown below.
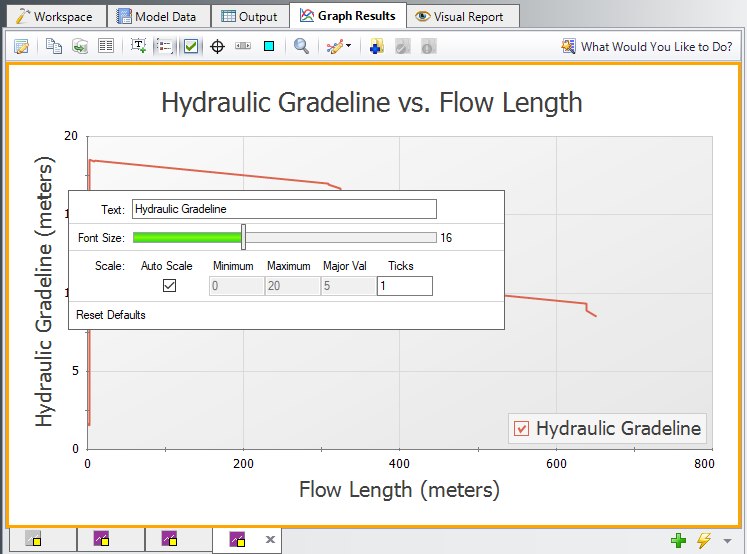
From the Graph Results window the formatting for the graph can all be customized by using the Quick Access Panel. Things like axis titles and graph titles can also be formatted by right-clicking them directly on the graph as is shown below.
Graphs can be printed to pdf like with the Output and Visual Report windows. However, they can also be directly converted to an image by right-clicking the graph and choosing the "Copy Graph Image" option from the right-click menu.
More Info
This blog provided just a basic overview of options available in the Output, Visual Report and Graph Results windows. For more information on the features shown here and for info on more advanced options check out the resources below:
Comments