AFT Blog
Know Your Pump & System Curves – Part 2A
Many users enjoyed my previous blog, "Know Your Pump & System Curves – Part 1" and greatly anticipated the release of Part 2. I'm going to split Part 2 into two separate blogs:
Part 2A
- Brief discussion on why system curves matter
- Pump & System Curves for multi-branched piping systems
- §How you can have different system curves for the same system
Part 2B
- System curves for systems changing over time
- When multiple system curves exist for a single system with multiple pumps
As I read through the previous blog, I realized the main focus was on what system curves are, how to generate them (within AFT Fathom) and how to understand them. However, I did not spend much time on "why" system curves are important and where they have value. Let's briefly address the "why".
Why would you want a system curve? Why does the shape and how it changes matter? Why is it valuable?
There are many reasons, but here are some important ones.
- To understand pump operation at original design flow
- To understand pump operation away from original design flow with system changes
Plotting pump and system curves together is useful because they graphically show where the pump operates with respect to the system curve. Why do you care where the pump operates and what the system curve looks like?
It's all about the Best Efficiency Point (BEP), the flow rate at which the pump's efficiency is the greatest.The goal is to operate as close to the BEP as possible.This maintains reliability, uptime, profits, etc. Operating away from BEP is where problems start to happen, as described in a previous blog. Understanding the shape of the system curve (i.e., steep curves for friction dominated systems or flatter curves for static dominated systems) and how it changes with the system, allows you to understand how well your pump is operating and when it will cause problems. Knowing where your pump operates, allows you to determine how to modify your system or its operation to keep the pump operating close to BEP.
Another question you could address would be, will adding more pumps in parallel generate more flow? Or has corrosion inside the pipes added so much resistance that it's time to clean or replace the piping? Or maybe someone forgot to remove an orifice plate somewhere. Piping corrosion and orifice plates are a couple of examples of many things that will add more frictional resistance to a system, thus increasing the steepness of a system curve, causing pumps to operate further back on their curves at lower flows, away from the BEP.
Although system curves can be useful, they can also be confusing and difficult to generate. System curves can involve various complexities, ambiguities, and limitations in certain situations. Sometimes, multiple system curves might exist where a single unique system curve that represents the overall resistance does not. The system with a control valve in the Part 1 blog was an example where a single unique system curve does not exist.It depended on if the resistance of the control valve should be included in the system curve or not. This led to two different system curves for the same system (see Figures 11 & 12 from Part 1).
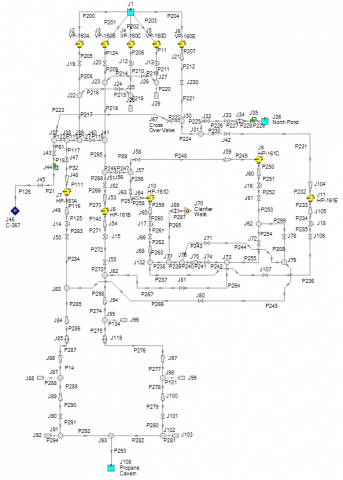
Consider Figure 1 which is the AFT Fathom model for the raw brine injection system case study where Flowserve improved reliability for a piping network that had 41 repairs in five years, costing the facility $1.23 million.If you were asked to provide a system curve for this network, what would you do? Looking at their Test Scenario #7 where only two pumps were operating, you could generate six different system curves with respect to the pumps alone (one for the composite system curve for two vertical pumps in parallel and then one for each horizontal pump). Multiple system curves from different pumps in a single network will be demonstrated in another blog. The main point here is that this is an example of a system where the concept of a unique system curve does not exist and may not be very meaningful.
It is just as important to understand when system curves have limitations and may not be useful as it is for when they provide great value. With the brine injection system itself, the concept of a system curve breaks down because there are so many system curves with this network. Also, the system curve (or system curves) does not tell you anything about the flow distribution through the system, control valve open percentages, NPSHA to NPSHR margin, which pumps should operate, which flow paths should be shut off, etc.
Okay, now back to the "whats" and the "hows" of Part 2.
Before we look at how AFT Fathom plots system curves and calculates the static head for multibranched systems, let's see what the experts have to say.
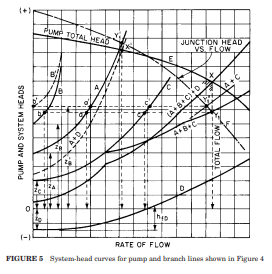
In the "Pump Handbook", Third Edition by Karassik, Messina, Cooper, and Heald, Section 8.2 discusses Branch-Line Pumping Systems. There is a discussion on how to generate a system curve for an open-ended pumping system with multiple branch lines, such as the one shown in Figure 2. J.P. Messina outlines how to develop a system curve for a network such is this by considering the individual flow paths separately.
Often, multiple system curves exist for a single system, especially ones with multiple flow paths. The system curve we care about is a cumulative curve made up of the individual system curves. As mentioned in the previous blog, system curves are developed with respect to a specific point in a system. Figure 3 below illustrates several system curves for the multi-branched network in Figure 2.
It can be difficult to generate a unique overall system curve that represents the entire system resistance, especially if you're doing it by hand. Which curve best represents the entire system resistance? It depends on the reference point you are using. The system resistance at the pump location is different than the system resistance at the branch point where the flow splits. If you look carefully, the system curve at the branch point is represented by curve "F", which accounts for the pump total head in Figure 3. The most practical place to generate a system curve to represent the overall system resistance is at the location of a pump because this will show the frictional resistance and elevation change a pump must overcome to supply a given flow.
Here's a point of complexity and confusion for creating a system curve for a network like in Figure 2. Should reverse flow into the system be allowed when generating the curve? Messina mentions that forward flow into the reservoirs should not be assumed. There is a limiting elevation for the reservoirs such that they could potentially supply the system instead. Different overall system curves exist depending on if reverse flow is allowed or not. This will also impact the static head that a pump needs to overcome at zero flow. This can be demonstrated with AFT Fathom.
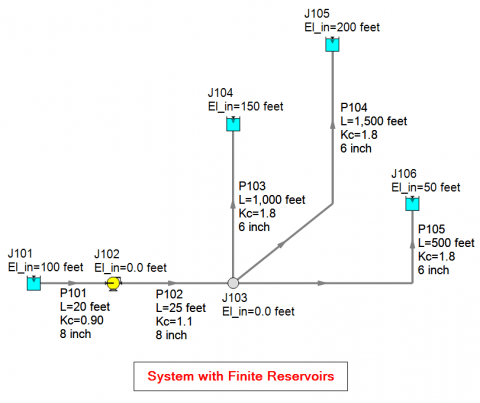
Let's consider the multi-branched piping system below in Figure 4 which is like that from the Pump Handbook. Each reservoir is at a different elevation with piping of different lengths. Each pipe includes minor losses from fittings represented with an additional K factor (Kc).
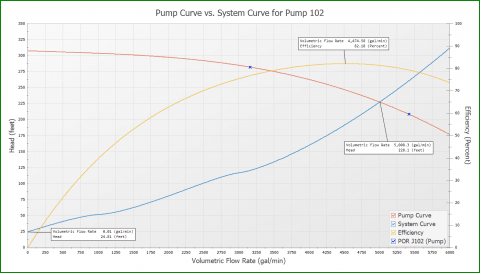
Figure 5 is the pump and system curve for the system in Figure 4, generated by AFT Fathom. Also included is the efficiency curve and the Preferred Operating Range (POR) data points as dictated by ANSI/HI 9.6.3-2017 for the Guideline for Operating Regions of Rotodynamic Pumps. This helps clearly identify if the pump and system curves intersect within the POR of 70% - 120% of the BEP. The pump is operating at around 5,000 gpm (1,136 m3/hr), which is the original design flow rate for this piping system. This is about 111% of BEP.
It is important to point out that there is nothing preventing reverse flow in the branch pipes. Therefore, as AFT Fathom generates the system curve, discharge reservoirs J104 and J105 will supply flow into the system through pipes P103 and P104 at low flow rates. How can you see that this is the case? Simply change the pump to a fixed flow model instead of a pump curve and set the flow to a low flow rate. Then examine the resulting flow rates in the pipes and you will potentially see a negative flow rate which is indicative of reverse flow.
What is the static head for a system like in Figure 2 from the Pump Handbook? This is where there is confusion and ambiguity because the static head depends on if reverse flow into the system is allowed or not while generating the system curve.
"Know Your Pump & System Curves – Part 1" discussed static head and how to calculate it. Static head is the difference in Liquid Surface Elevation between supply and discharge reservoirs. Surface pressure needs to be included in the static head as well for pressurized tanks. The static head of the system does not change as the flow changes.
Based upon the curve from AFT Fathom for Figure 4, the static head is about 25 feet (7.6 m). Is this correct? How does AFT Fathom come up with this value?
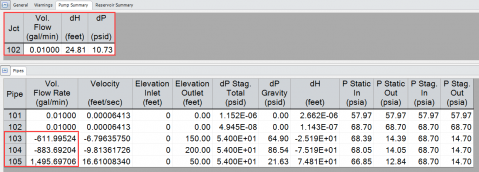
Think back to how AFT Fathom generates a system curve. The reference point AFT Fathom uses for generating a system curve is a pump. AFT Fathom runs the model in the background over a wide range of flow rates using a fixed flow model (instead of the pump curve) for the pump to determine the required increase in pressure at that location to overcome system resistance and elevation change at each flow rate. Let's run the model with the pump set to a fixed flow rate of 0.01 GPM to understand why AFT Fathom calculated 25 ft (7.6 m) for the static head.
The model in Figure 4 is fully primed and discharging to large reservoirs. A pump junction represents a mathematical point that increases pressure/head for a given flow. From the results in Figure 6, an increase in head of about 25 feet at the pump location is required even to supply just 0.01 GPM through the pump. There is reverse flow in pipes P103 and P104. Reservoirs J104 and J105 are supplying flow (and a significant amount of it) to the system. Essentially, the "static head" of 25 feet (or pressure increase of ~11 psi) of the "system" is to prevent reverse flow through the pump itself.
Therefore, the static head in the system curve for Figure 5 is not determined simply by an elevation difference or combination of elevation differences. It is the increase in head (or pressure) of 25 feet (11 psi) that is required to maintain 0.01 GPM through the mathematical location of the pump. Basically, the increase in pressure necessary to prevent reverse flow through that point (i.e., the pump suction & discharge lines). If there is no pump, or if we turned it off, we would probably see reverse flow through the suction & discharge piping as well.
A key assumption in AFT Fathom is that ALL pipes are liquid full. Thus, AFT Fathom assumes the system is fully primed. There are important aspects to understand in modeling a piping system that is not fully primed. Here is where you can find a blog article on that topic, "Overcoming New Heights – System Priming Before Siphon Effect Can Help".
If the discharge reservoir junctions represent finite tanks instead of large bodies of fluid where liquid heights do not change over relatively short periods of time, the system would drain and the system curve in Figure 5 would not represent the real system. This is because air would enter the system at low flows while the system curve that AFT Fathom generates would still assume liquid densities at the pump when pipes in other areas of the system would be filled with air.
This highlights the point of confusion for generating a system curve for a network such as this. It is also a good argument that reverse flow should probably not be allowed at lower flow rates when generating the system curve. Liquid full pipes would be assumed when the system would drain at low flow rates if the reservoirs represent finite tanks. Check valves can be used to prevent reverse flow in that case.
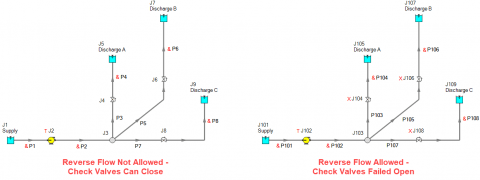
Figure 7 is a modified version of the AFT Fathom model from Figure 4. With some creative modeling, we can easily show how different system curves can be generated for this system for the case of allowing reverse flow (like in Figure 4) or preventing reverse flow with check valves. Two nearly identical systems on a single Workspace are modeled in Figure 7. I am using the AFT Fathom eXtended Time Simulation (XTS) add-on module. All reservoir junctions still represent infinite reservoirs where the liquid heights do not change. Both pumps J2 and J102 are specified with the fixed flow pump model and have a transient defined where the flow through the pump increases from 0.01 GPM to 6,000 GPM over a period of 10 minutes. Thus, the flow increases by 100 GPM every 10 seconds. The intention here is to generate a system curve "manually" because at each time step, the required pump head will be calculated to supply the flow at a given time step through the pump. The resulting flow rate and pump head can then be plotted to create a system curve.
The first system with pipes P1 – P8 and J1 – J9 has check valves in the branch paths which WILL close when there is reverse flow through the branch paths. For the second system with pipes P101 – P108 and J101 – J109, check valves are included, but their Special Condition is set to "Failed Open". This will force the check valves in that system to remain open, whether there is any reverse flow through the branch paths or not. This would be identical to the system in Figure 4 with no check valves at all.
ALL check valves in each system are lossless with a K factor of zero, will close upon a velocity of zero feet/second, and require zero pressure drop across the check valve to re-open it. Therefore, the check valves do NOT add any additional frictional resistance to the system and are only present for the sake of preventing reverse flow.
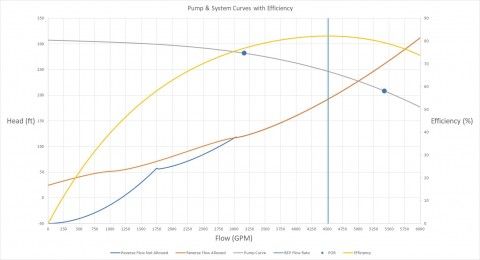
Figure 8 is the system curves plotted together for the two systems in Figure 7. The blue curve is for the system that does not allow reverse flow (check valves will close). The orange curve is for the system that does allow reverse flow (check valves stay open), and is identical to the system and system curves in Figures 4 and 5. Also, included in the plot is the pump curve, efficiency curve, BEP flow rate and the Preferred Operating Region (POR) to highlight the bounds from 70% to 120% of BEP. This demonstrates that the pump is operating within good proximity to the BEP.
This plot illustrates the confusion and ambiguity on how to generate a system curve for a more complicated system with branching flow paths. Both system curves are correct, but the one you should use depends if your system will allow reverse flow or not. The orange curve shows a static head of about 25 feet and the reason for that value is explained earlier. The blue system curve is for the system where the check valves will close to prevent reverse flow from the discharge reservoirs. The static head for that system is -50 feet because at low flow rates, the check valves for the paths to reservoirs A & B will close, and therefore, flow through the pump will only be supplied to reservoir C.The static head in this sense is the difference in elevation from discharge reservoir C to the supply reservoir and would be -50 feet.
When the system curve is negative, a pump is not required to generate flow. Flow is driven by elevation differences for flow rates in the range where the system curve is negative. Therefore, mathematically, AFT Fathom would calculate a negative head rise across the pump junction, indicating that the pump would have to "remove energy" from the fluid to supply a given flow.
The blue curve for the system not allowing reverse flow is in a sense, broken up into three parts. From 0 to about 1,750 GPM, flow is only to discharge reservoir C. For flows ranging from about 1,750 GPM to 3,025 GPM, there is flow to discharge reservoirs A & C. At a flow rate of about 3,025 GPM, the check valve to discharge reservoir B opens and now there is flow to discharge reservoir B as well. This is what causes the odd shape in the curve. When quantifying the entire system resistance with respect to a specific point such as a pump, not all flow paths will see flow at low flow rates if reverse flow from discharge reservoirs is prevented.
In conclusion, even though the system curve for a multibranched network can be generated in multiple ways, it will still indicate graphically where the pump is operating. For the system described here, the pump and system curves show that the pump is operating within close proximity to the BEP. As other system changes cause the system curve to change, it will be clear if the pump is going to operate reliably and efficiently. However, the system curve here will not provide much more useful information due to the limitations caused by the existence of multiple system curves and the fact that the system curve tells you nothing about the flow distribution, NPSH margin, control valve operation, etc. Therefore, when performing a flow analysis, it is important to look beyond a system curve to understand how the system operates. With today's sophisticated flow analysis software tools like AFT Fathom, there are other methods that will allow an engineer to understand their system more intimately than what a system curve can provide.
Thank you for reading the blog, here is where you can read "Know Your Pump & System Curves – Part 2B" which will demonstrate how system curves change over time as well as the impact on system curves when you have multiple pumps in other parts of the system that are not in parallel or series operation.



Comments