AFT Blog
Give me some details about Detailed Tees!
Frequently in tech support, when a difficult-to-converge model comes in, one of the first things we check is whether or not any tees in the model are being modeled as detailed tees. The reason for this is that the hydraulic calculations involving detailed tees can be complex due to the interdependence between velocity and pressure loss for each pipe connected to the tee. Iteration must, therefore, be performed to find a pressure loss and flow through each connecting pipe that agrees with the rest of the flow and pressure solutions in the model. This begs the question, then, what calculations are used to calculate the pressure loss and velocity through detailed tees, and what are some common questions that users of AFT software run into? Let’s take a look!
So what does the term “Detailed Tee” mean anyways? A detailed tee in AFT Software refers to any tee junction with the Loss Model specified as “Detailed”. If modeling the tee as Detailed, the orientation of the connecting pipes must be specified according to the physical arrangement of the pipes, and the type of tee must be specified under “Type”. AFT software will then iterate to determine what the flows and pressures must be through the tee in order to get the model to converge using the Idelchik correlations (Reference 1). Note that, if the Loss Model is specified as “Simple”, no loss will be attributed to the tee. Modeling a tee as Simple is no different than using a lossless Branch junction with three connecting pipes.
The Idelchik correlations are used based on the type of tee that you have specified, and whether the tee is converging or diverging according to the flow direction. We will review a simple AFT Fathom model to help understand how the losses associated with the tees are calculated. To do this, see the model in Figure 1.
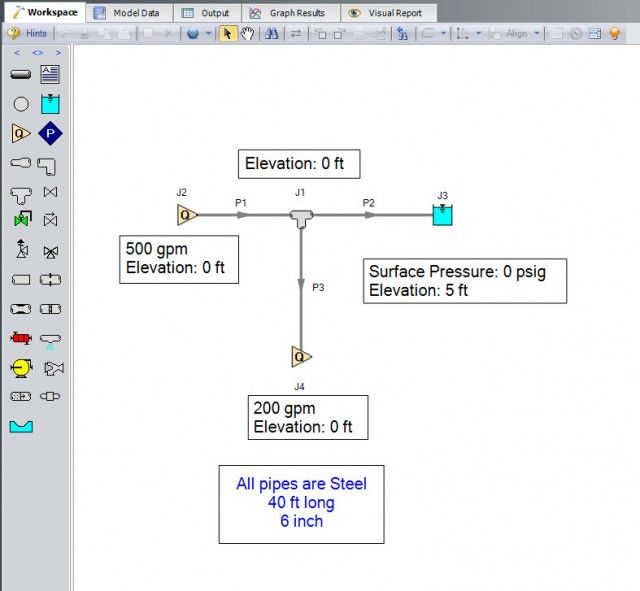
In Figure 1, Junction J1 is modeled as a detailed tee with a Sharp, Straight Run. Because two flow paths flow out of J1 and only one path flows into it, this is a diverging tee.
In a diverging tee, there is a separate loss associated with the two pipes diverging from the tee. Let’s take a look at how to calculate the K factors for theses two pipes from the tee in this model.
The correlation on page 451 from Reference (1) shows that the K factor for the straight-flow pipe ![]() (with respect to the common-flow pipe velocity) is shown in Equation 1.
(with respect to the common-flow pipe velocity) is shown in Equation 1.

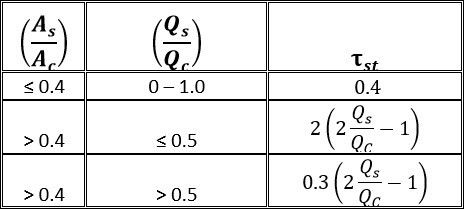
Where ![]() is given by Table 1:
is given by Table 1:
In Equation 1, ρ represents the fluid density, and v represents the velocity. Q represents the flow through a specified pipe connected to the tee, and this specified pipe is indicated with a subscript. These subscripts can serve as a major source of confusion, so ensure that you pay special attention to them. There are three subscripts that can appear in detailed tee calculations: c, s, and st. The subscript c represents the common-flow pipe (the pipe that contains all the flow from the other two pipes) and the subscript st represents the straight-flow pipe (the pipe that continues on a straight line from the common-flow pipe). A subscript with s represents the side branch-flow pipe. For a diverging tee, see the image below to see what pipe corresponds to each subscript.
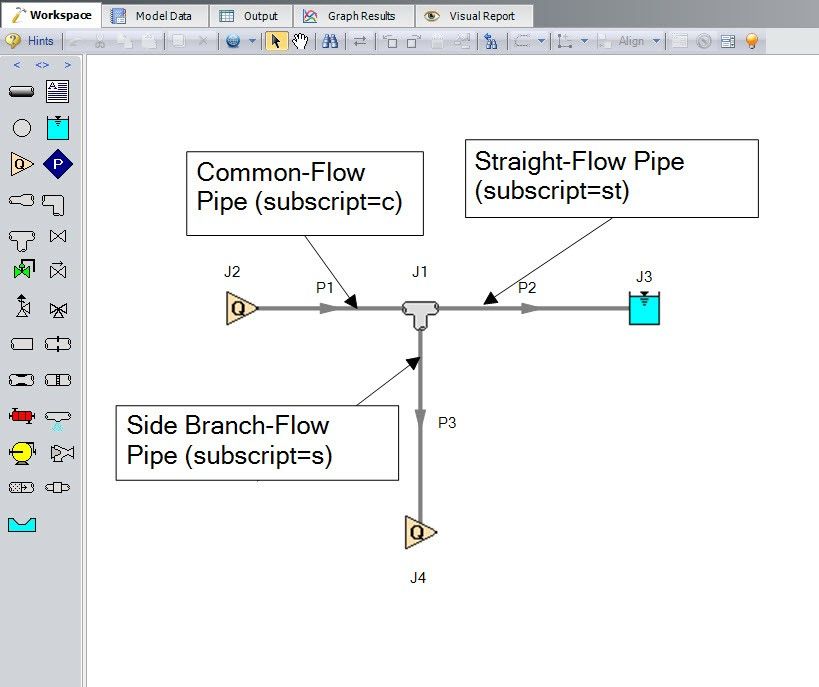
Note that Figure 2 shows a visual representation of which subscript is associated with which pipe in the detailed tee Idelchik correlations. However, the Solver in AFT software does not require the model on the Workspace to be drawn according to the tee’s actual orientation because the orientation specified in the tee’s Properties window is how the software will know which connecting pipe is associated with which subscript.
Equation 2 shows the equation from Reference (1) that calculates the K factor for the side branch-flow pipe ![]() with respect to the common-flow velocity for the tee in Figure 1.
with respect to the common-flow velocity for the tee in Figure 1.

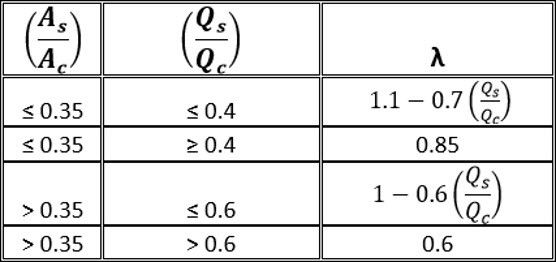
Where ![]() is given by the following table:
is given by the following table:
Now that we know the equations to calculate the K factor for both the straight-flow pipe and the side branch-flow pipe, let’s apply them to our model. Because the total system flow is specified at J2 at 500 gpm and the flow through the side branch-flow pipe is fixed at 200 gpm, we know that there is 300 gpm through the straight-flow pipe.
Let’s start with the straight-flow pipe calculations. Figure 3 shows a screenshot from the spreadsheet used to perform the necessary calculations.
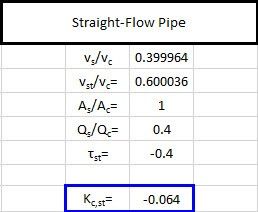
The K factor for the straight run pipe, when applied to the combined-flow pipe’s velocity, is -0.064. Using Equation 1, this equates to a pressure drop of -0.0133 psid. You will notice that the pressure loss Idelchik predicts is negative, indicating that energy is actually being added to the straight pipe. How can this be? Although it may seem counterintuitive, at certain flow ratios of Qs/Qc, a portion of fluid in the slow moving boundary layer adjacent to the pipe wall passes into the side branch and a part of the momentum is transferred to the flow in the straight passage. While the energy in the straight pipe is increased, the side branch experiences an increase of losses, so the overall process results in an irreversible pressure loss.
The K factor for the branch-flow pipe, when applied to the branch pipe’s velocity, is 0.882. Using Equation 2, this equates to a pressure drop of 0.183 psid. See Figure 4 for a screenshot from the spreadsheet.
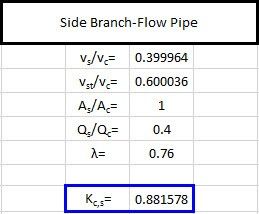
We can now compare our results to the Output reported in AFT Fathom. The detailed tee-specific Output is shown in the Junctions section of the Output on the bottom third of the screen under the Multiple Losses tab.
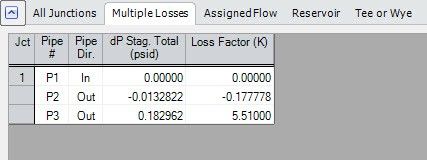
Notice in Figure 5 that, while the pressure drop matches our calculations, the K factors do not. Why is this? The answer to this question is that AFT Fathom reports the Kst and Ks with respect to the straight-flow pipe and the side branch pipe velocities, respectively. To convert these K factors, use Equations 3 and 4 below.
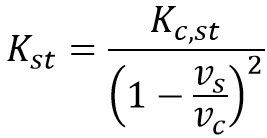
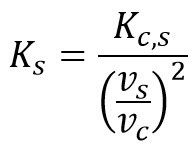
After applying Equations 3 and 4 to the resistance coefficients we previously calculated, the resulting K factors agree with those calculated by AFT Fathom.
It is important to note that, as long as the K factor is applied to the correct velocity in Equation 5 below, the pressure loss associated with that pipe will be equivalent.

After reading this blog, you are now equipped to calculate the K factors for detailed tees using the Idelchik correlations. While they can at first seem intimidating, these calculations are very straight-forward if the fluid velocity or pressure loss is known. Now that you are a detailed tee expert, check out some of our other blogs here to become an expert in all things AFT!
REFERENCES
(1) Handbook of Hydraulic Resistance, 3rd Edition. I.E. Idelchik. 1994 C.R.C Press, Inc.


Comments