
AFT Blog
Pulsation Frequency Analysis Takes a New Turn
In recent years, engineering efforts have been increasingly focused on analyzing and preventing detrimental pulsations in pipelines. One major source of these pulsations is caused by acoustical resonance. Undesirable acoustical resonance happens when pressure pulses (the source of which is often a positive displacement pump) excite the system's natural frequencies.
Applied Flow Technology's PFA (Pulsation Frequency Analysis) module has been developed to assist engineers perform this analysis. The PFA module, used in conjunction with AFT Impulse, determines liquid system's natural frequencies, allowing engineers to act preventively when designing and specifying systems. It also helps engineers troubleshoot vibration in installed systems and identify whether acoustic resonance is the cause.
Using the PFA module is quite simple, especially if you are already familiar with using AFT Impulse.
The PFA module automates most of the process using a series of steps.
1) Build the model in AFT Impulse
2 ) Specify the characteristics of the pulse
3) Apply the forcing function to the source of the pulse
4) Run the model
5) Generate a Bode plot, displaying Frequency vs. Magnitude
For PD Pump pulsations:
6) Specify excitation frequencies to analyze from specific pump RPM
7) Generate child scenarios for each selected excitation pump RPM
8) Run each child scenario and determine resulting acoustic magnitudes
9) Automatically compare peak-to-peak pressure pulsation to API 674 requirements to ensure compliance
Some of the key features and main steps in using the PFA module have been detailed below.
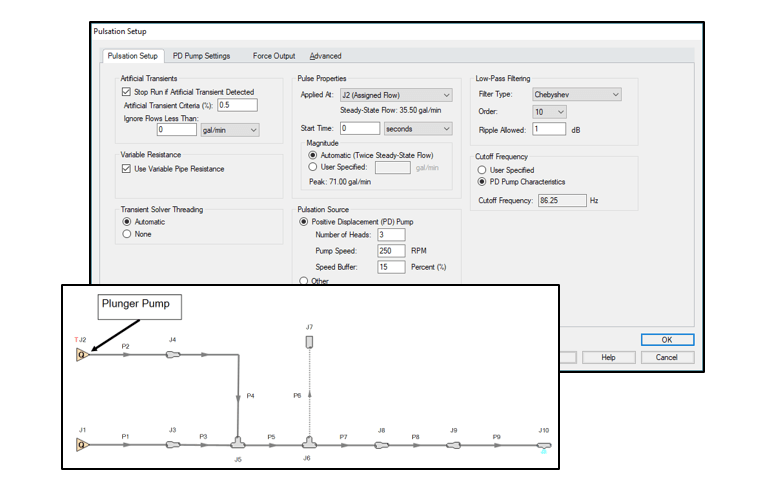
Figure 1: Model and Data Input
The model being used for this demonstration includes a PD plunger pump system. The flow junction called out represents the PD pump of interest. We then entered the PD pump input data.
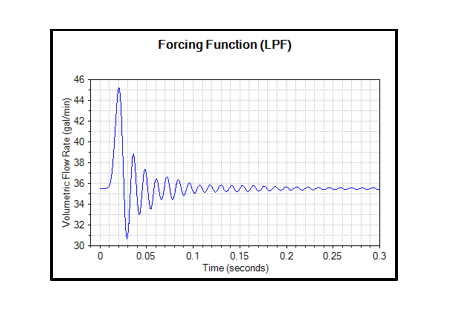
Figure 2: Apply a Low Pass Filter
The PFA module applies a Low Pass Filter to the specified pulse to focus on the desired frequency response range. A forcing function of the Low Pass Filter is then generated and associated with the flow junction on the Workspace.
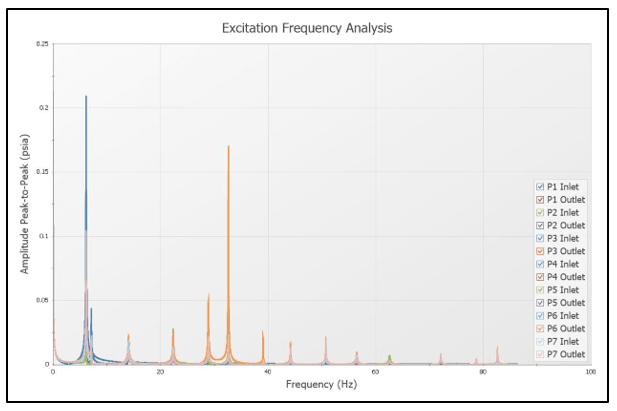
Figure 3: Observe Excited Frequencies
After the model is run, a Bode plot is generated at any pipe station specified by the engineer. For our demonstration, the Frequency vs. Magnitude plot for several pipe stations has been plotted.
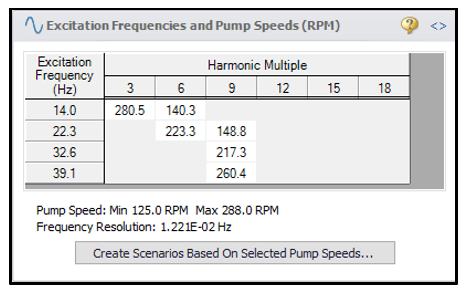
Figure 4: Create Scenarios
Once the Excitation Frequency Analysis has been created, the frequencies with significant magnitudes can be selected and added to the Pump RPM Evaluation Panel. After all desired excitation frequencies have been added, PFA automatically creates separate read-only scenarios for each selected excitation frequency.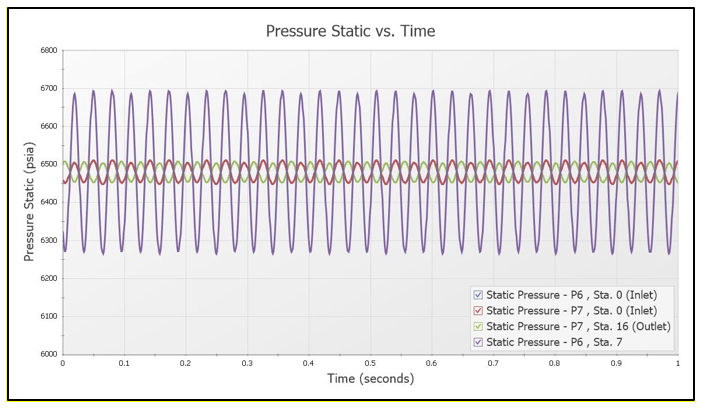
Figure 5: Analyze Results
Conclusion
AFT Impulse's PFA module provides an exciting opportunity for engineers looking to improve the safety, reliability, and performance of their hydraulic systems.
The incredibly straightforward interface can be learned in a matter of a few hours, and mastery is quickly possible with AFT's ample supporting documents, tech support, and training options.
Comments