AFT Blog
Using Liquid Accumulators in AFT Impulse
Many engineers are familiar with gas accumulators and their ability to aid in surge suppression modeled in AFT Impulse, but what about liquid accumulators? Liquid accumulators are different from gas accumulators in that they are assumed to be liquid full and do not have any gas that can compress and expand in order to dampen pressure spikes caused by water hammer. Liquid accumulators change the system response to pressure spikes, but they operate differently than gas accumulators.
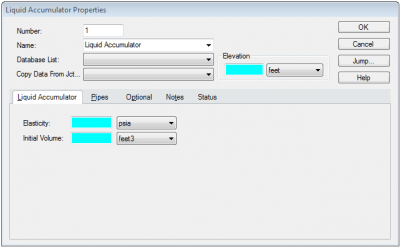
There are only three required input parameters for liquid accumulators; Elevation, Elasticity, and Initial Volume.
Figure 1: Liquid Accumulator Properties Window
Initial Volume is simply how much space is inside of your liquid accumulator and Elasticity (effective bulk modulus) is the capacity of the liquid accumulator to expand. Low elasticity values would indicate an accumulator with a high capacity to expand (a balloon) and high elasticity values would indicate an accumulator with low capacity to expand (high strength steel). One thing to keep in mind is that even though the material of the liquid accumulator does affect the bulk modulus of elasticity, the elasticity is not actually a material property. The bulk modulus of elasticity is also dependent on the geometry of the liquid accumulator. This means not all steel liquid accumulators have the same effective bulk modulus even though they may have the same Young’s Modulus of Elasticity, for example 200 GPa or 29.0×10⁶ psi. Often times this parameter is hard to find and very few manufacturers provide this data. Therefore it may need to be determined through experimental data.
The following equation relates the effective bulk modulus (K’), initial volume (V), change in volume (DV), and change in pressure (DP) for a liquid accumulator.
Based upon this relationship, a larger K’ value means that the liquid accumulator will allow a larger change in pressure across itself. At very large K’ values (meaning the liquid accumulator is much stiffer than the surrounding pipe) the liquid accumulator will allow the transient pressure waves to communicate through it with very little effect (i.e., very low surge suppression). If the accumulator is not flexible, then what is absorbing the energy of the pressure wave? Nothing, and therefore the wave continues past the liquid accumulator. At very low values of K’ the liquid accumulator will only allow very small changes in pressure across itself. This is to say the accumulator will not allow large changes in pressure across itself and this isolates the other pipes connecting to the liquid accumulator from the pipe that has the pressure wave in it. Thus, the liquid accumulator will reflect pressure and velocity waves rather than transmitting them through the accumulator to the rest of the system.
It can also be seen that large initial volumes only allow small changes in pressure across the liquid accumulator junction. At very large volumes the liquid accumulator acts more like a reservoir. This means that the liquid accumulator would behave like a constant pressure and would not allow a pressure wave to transfer through itself. Small initial volumes allow more of the pressure wave to transfer through the liquid accumulator.
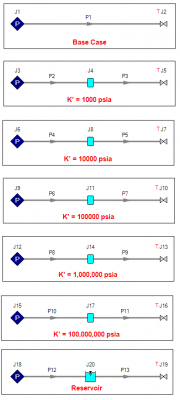
The effects of using different bulk modulus of elasticities and initial volumes for a liquid accumulator can be evaluated with an AFT Impulse model. I created a model that simulated an instantaneous closure of an exit valve that discharges into ambient conditions. This model has two scenarios created using the scenario manager. Both scenarios have a “control” where there is no liquid accumulator along the pipe between an assigned pressure junction and exit valve. In the first scenario initial volume is held constant while K’ (effective bulk modulus) is varied between 1000 psia and 100,000,000 psia in five different cases. The last case is a reservoir which isolates the upstream assigned pressure junction and perfectly reflects the pressure wave that starts at the closed valve. The setup can be seen here:
Figure 2: Test Model with varying K'
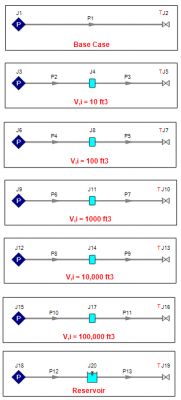
In the second scenario, K’ is held constant while the initial volume is varied between 10 ft3 and 100,000 ft3 in five different cases. The last case is a reservoir which isolates the upstream assigned pressure junction and perfectly reflects the pressure wave. The setup can be seen here:
Figure 3: Test Model with varying initial volume
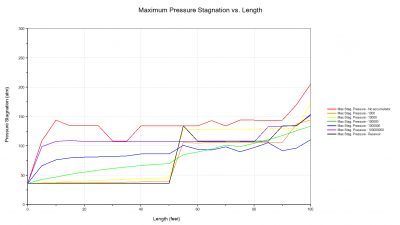
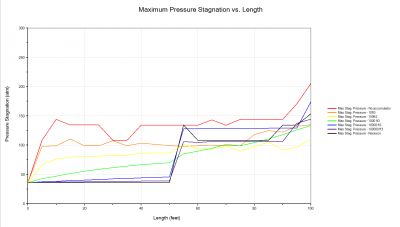
Figure 4: Maximum Pressure Stagnation vs. Length with varying K'
As seen in figure 4, the liquid accumulator behaves more like a reservoir with decreasing bulk modulus of elasticity, meaning pressure waves will reflect off the liquid accumulator rather than passing through. As the bulk modulus of elasticity increases, the liquid accumulator behaves like a rigid pipe, or as if there is no liquid accumulator in the pipeline at all.
Video 1: Variable K'
In the video you can see that each case responds to the valves closure with a pressure wave that propagates upstream until in hits the liquid accumulator at 50 feet. Once here the cases diverge. If you pause shortly after the pressure wave hits the accumulator you can see how the larger K’s behave more like there is no accumulator and how the smaller K’s behave more like there is a reservoir.
Figure 5: Maximum Pressure Stagnation vs. Length with varying initial volume
As shown in Figure 5, when the initial volume increases the liquid accumulator behaves more like a reservoir. As the initial volume of the liquid accumulator decreases, the system behaves more like there is no liquid accumulator.
Video 2: Variable Initial Volume
In the video you can see that each case responds to the valves closure with a pressure wave that propagates upstream until in hits the liquid accumulator at 50 feet. Once here the cases diverge. If you pause shortly after the pressure wave hits the accumulator you can see how the smaller volumes behave more like there is no accumulator and how the larger volumes behave more like there is a reservoir.
In summary, liquid accumulators are liquid full sections in a piping network that behave like flexible pipe. These sections change the system’s response to pressure waves that are created by transient events such as valve closures or openings and pump start-ups or trips. A stiff liquid accumulator will allow a pressure wave to transmit through the liquid accumulator more easily while a flexible liquid accumulator will reflect more of the pressure wave. A liquid accumulator with a large volume will behave similarly to a reservoir and reflect much of a pressure wave, while one with low volume will allow more of a pressure wave to transmit through. Overall, when using a liquid accumulator, be sure to properly balance these two variables (initial volume and bulk modulus of elasticity) so that liquid accumulators are properly implemented.



Comments 2
It is great! I didn't use liquid accumulator and it is very helpful for me. And I have a problem about your figure 4 and figure 5, how can you get the graph with 7 cases curves? thank you!
Hi Aaron,
To create multiple plots on the same graph I created several different groups and then used "Plot Multiple Paths Using Groups" option under the "Profile Along a Flow Path".
Here are more details steps about how I created Figure 4.
1. Select P1 and go to edit, groups, create, name the group "No Accumulator", and click ok until you are back to the workspace. The name you give the group is the name that appears on the graph.
2. Repeat step one for the rest of the cases.
3. Go to the graph results tab and select graph data.
4. Under the "Profile Along a Flow Path" select "Plot Multiple Paths Using Groups" and choose whatever groups you want to display.
5. I played with the color scheme to make the graph more intuitive.
I hope that helps!
Regards,
Dylan