AFT Blog
Now For Something Completely Different: The New Graph Guide in AFT Impulse 6
AFT Impulse will be celebrating it's 20th anniversary later this year in November. I was the original software developer of AFT Impulse back in 1996 and was still actively writing code up through AFT Impulse 4. So AFT Impulse is near and dear to my heart. Within the next few days we will be releasing AFT Impulse 6 and it will have some new and extremely powerful graphing features (more on that below).
As we started to test the new graphing features we were concerned that users would struggle to access these features. So we came up with an idea that turned into the Graph Guide.
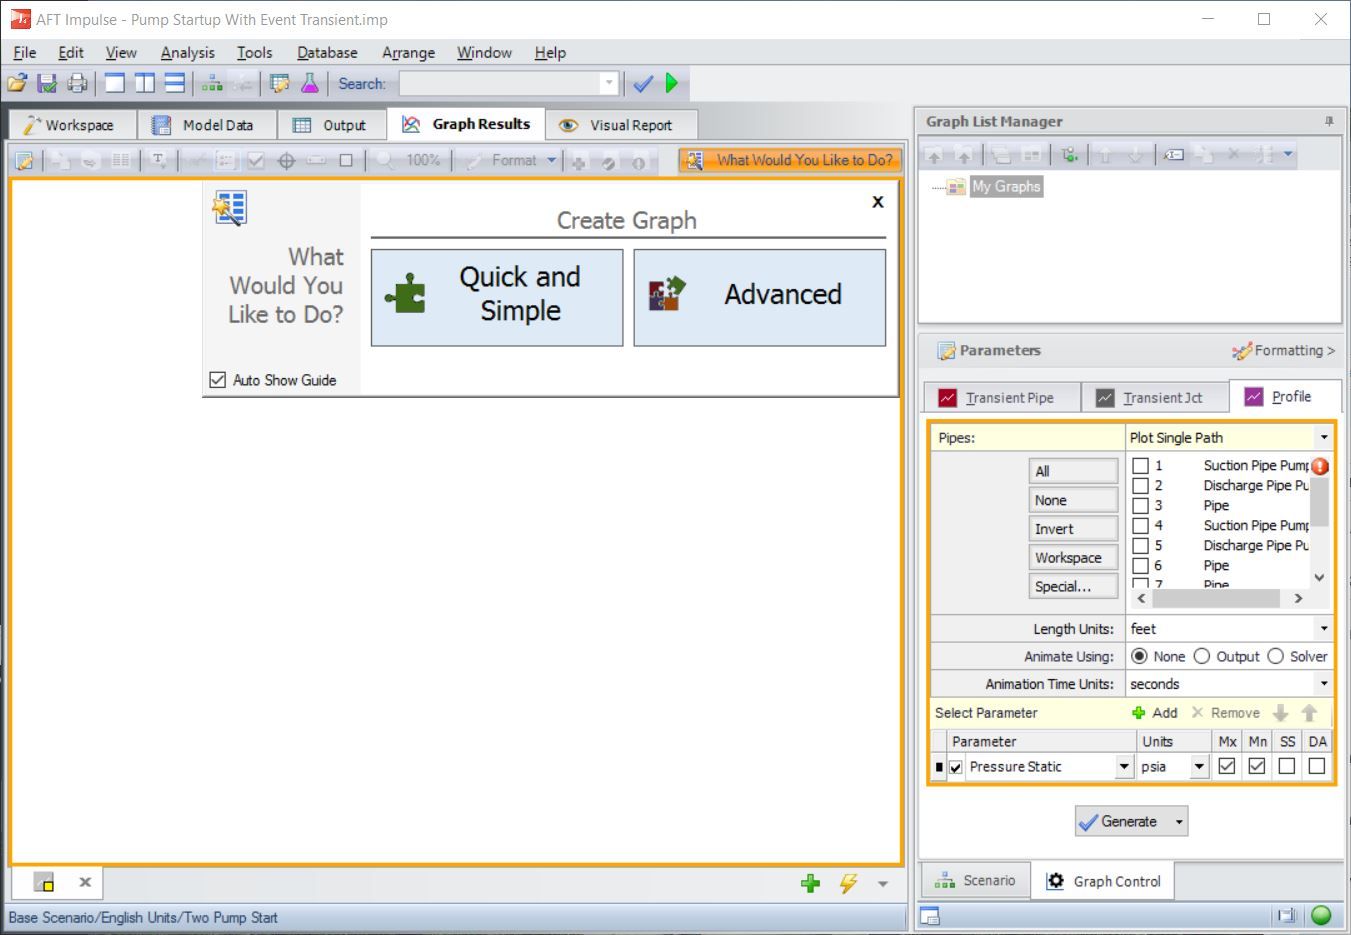
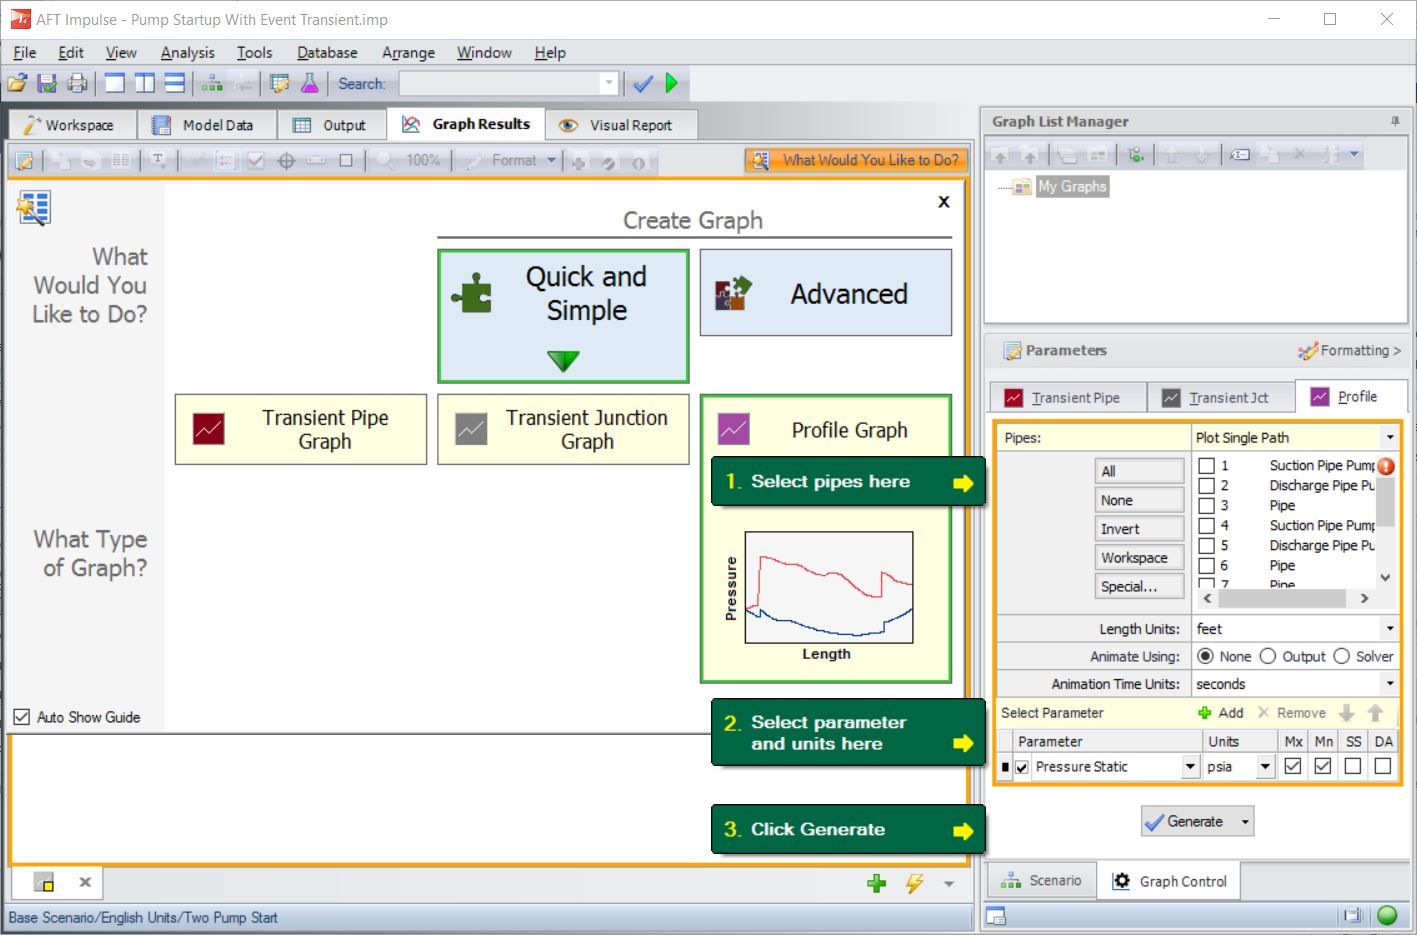
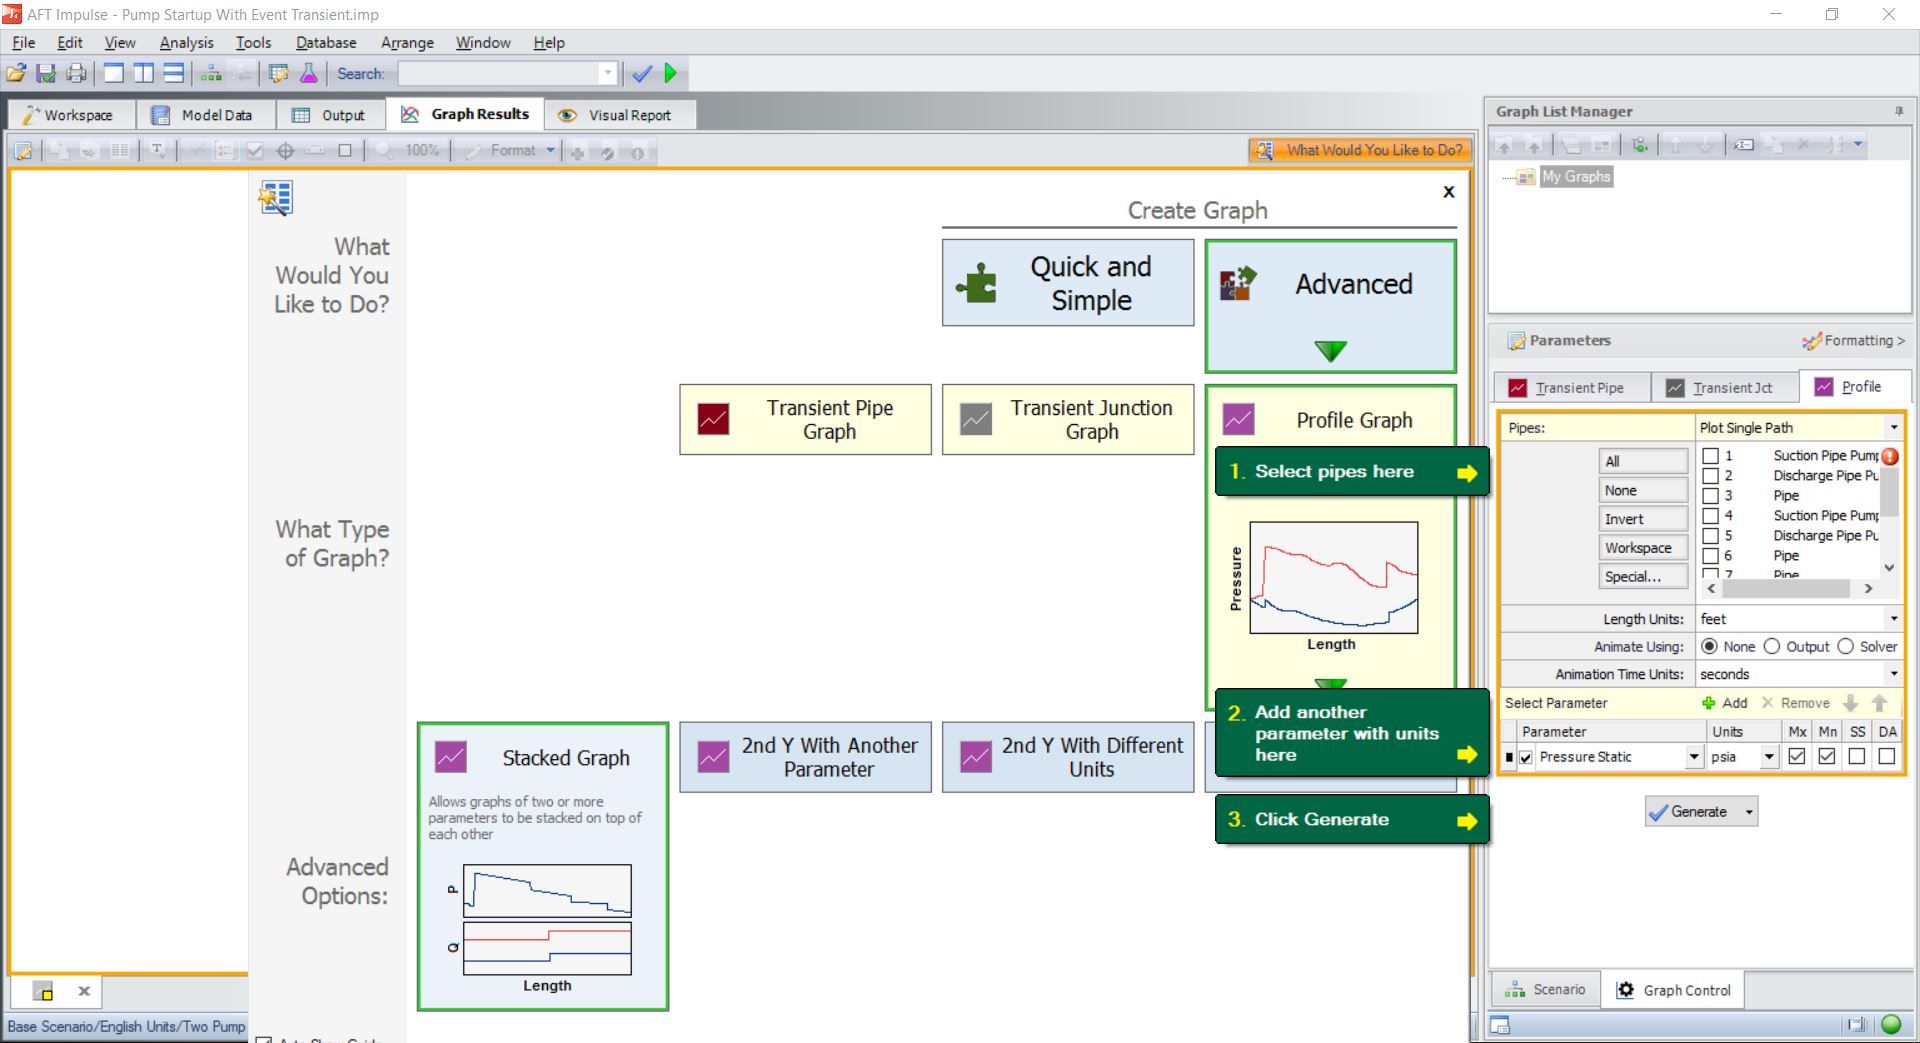
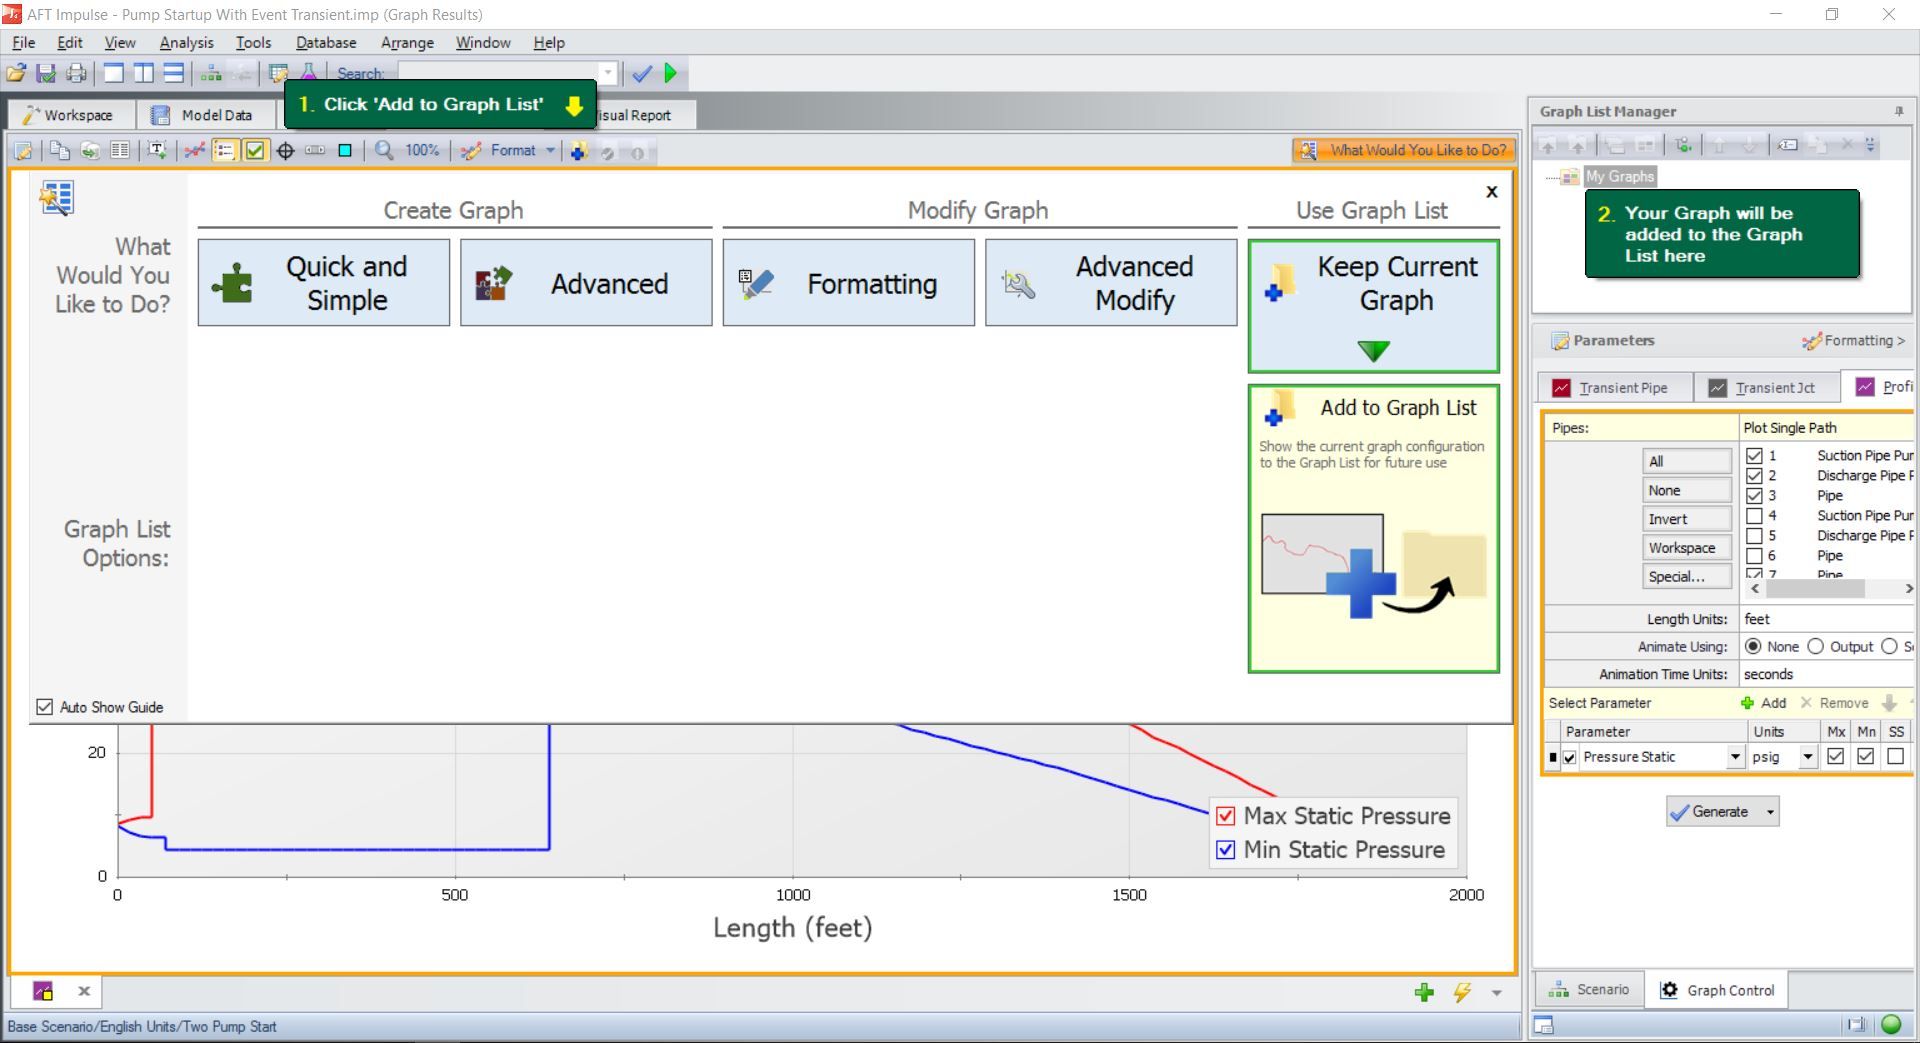
What is the Graph Guide, you ask? Well, in simple terms the Graph Guide is an interactive, hierarchical guide built into the Graph Results window which assists the user in creating, formatting and retaining simple and complicated graphs. When the user chooses what he/she wants to do, numbered "direction bubbles" appear on the screen to guide the user in accomplishing the task.
Below are some different images which give an idea of how the Graph Guide works.
Graph Guide display when a user first opens the Graph Results window
Graph Guide when user chooses the quick way to create a profile plot (notice the numbered steps around the screen shown in direction bubbles)
Graph Guide when a user chooses to create a more complicated stacked graph
Graph Guide when a user wants to keep a graph for future use in the Graph List Manager
We designed the Graph Guide to help the user accomplish at least 90% of what he/she would ever want to do in Graph Results. Once the Graph Guide is released in AFT Impulse 6, look for it soon in AFT Fathom 9 and AFT Arrow 6.
New Graphing Features in AFT Impulse 6
Here is a list of new graphing features in AFT Impulse 6:
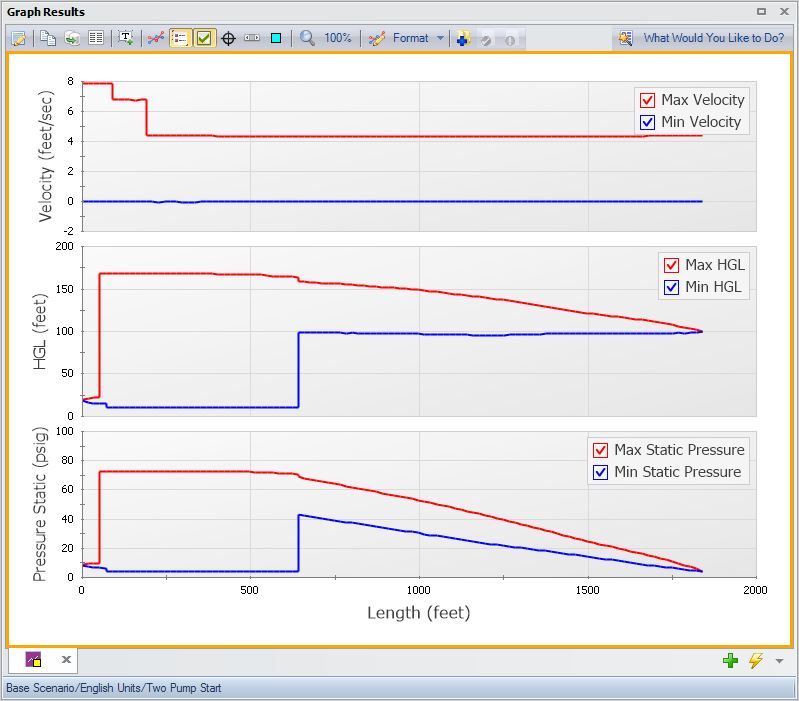
- Stacked graphs
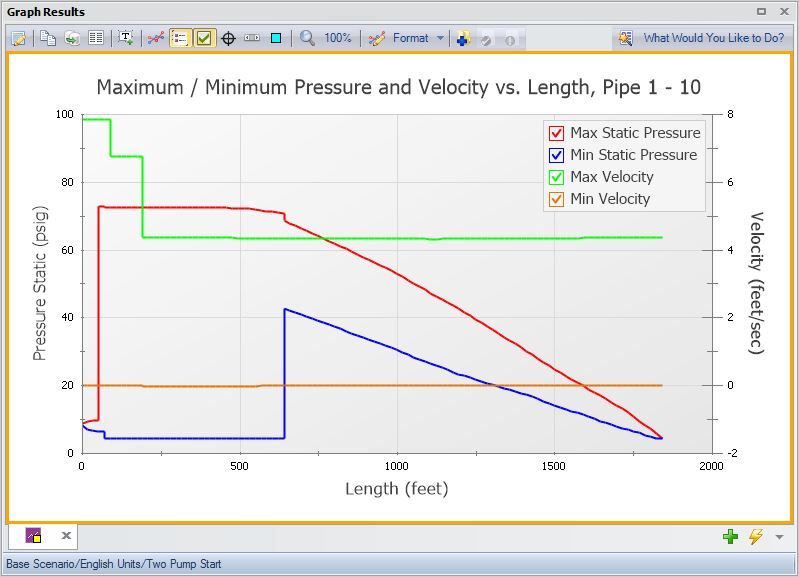
- Double Y-axis graphs
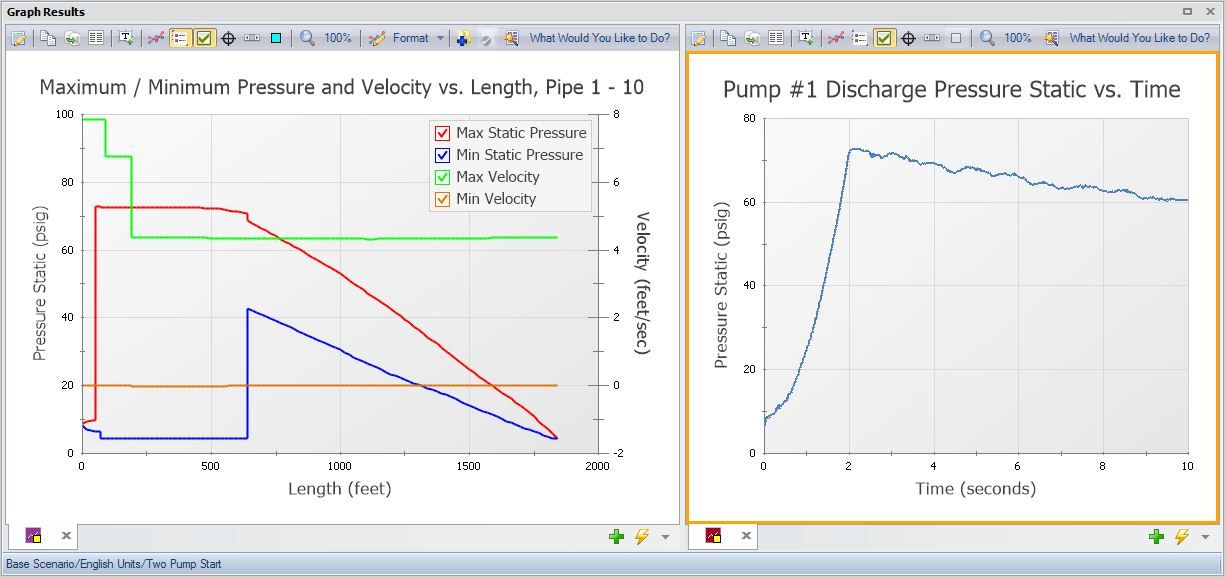
- Multiple graphs in tabs
- Multiple graphs on same tab
- Multiple graphs animated simultaneously
- New graphs can be launched from the Workspace after selected pipes or junctions of interest
- Graphs can be retained in the Graph List Manager is multiple folders to help organize and more easily regenerate related graphs
- Crosshair feature to help understand results
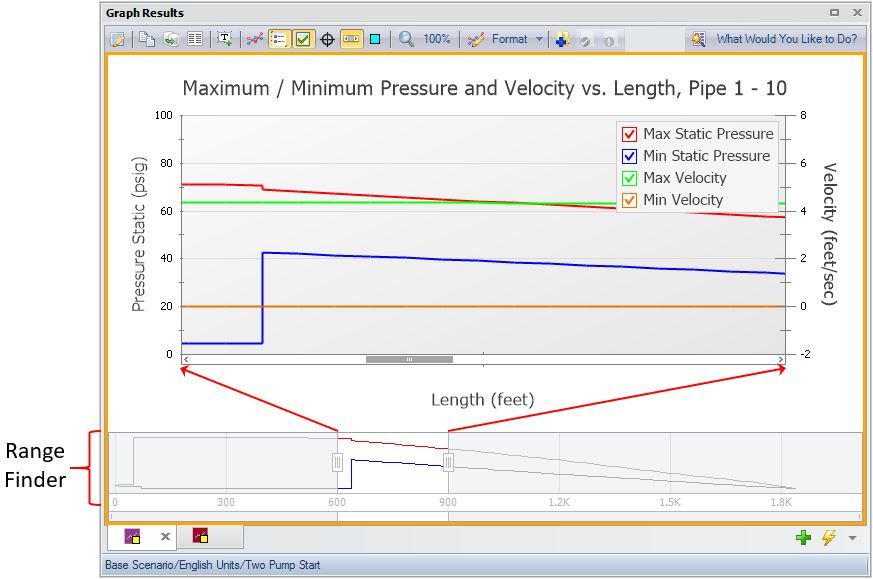
- Range Finder feature to help focus on a specific range of results
- Ability to save animation files directly into mp4 format
The following shows several screen captures where you can see these features.
Graphs can be stacked
Graphs can have a double Y-axis
Graphs can be organized on tabs
Graph Range Finder lets users focus in a certain portions of the graph
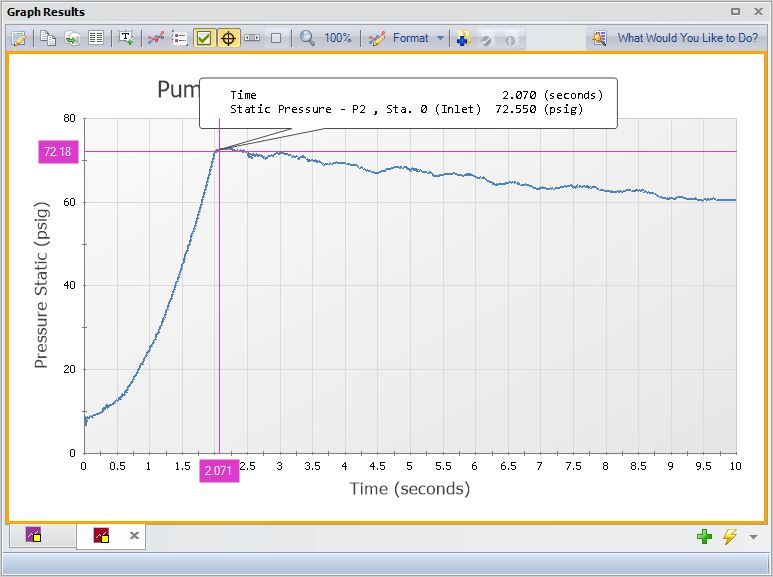
Graph Crosshair lets users highlight data for a particular calculation point
All of this will be available in the next few weeks in AFT Impulse 6, AFT Fathom 9 and AFT Arrow 6 - to give you more capability than ever before. Enjoy!



Comments 2
Hi Trey... this is really an awesome addition to AFT Impulse... I liked "Graph Range Finder lets users focus in a certain portions of the graph" this option.
Is it possible to obtain pressure stagnation Vs Time at the desired pipe station for a partial pipe segment