


AFT Blog
Welcome to the Applied Flow Technology Blog where you will find the latest news and training on how to use AFT Fathom, AFT Arrow, AFT Impulse, AFT xStream and other AFT software products.
The Opposite of Good Vibrations - Evaluating FIV, AIV, FIP Guidelines from AFT Fathom and AFT Arrow
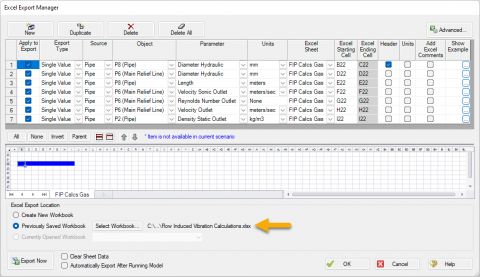
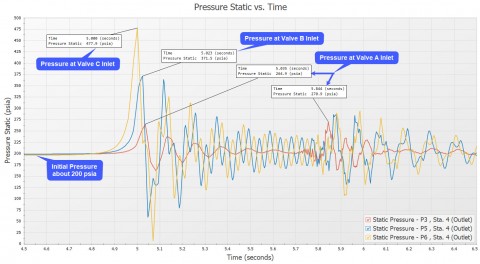
Learn how to use AFT Fathom and AFT Arrow to help calculate the Likelihood of Failure (LOF) for Flow Induced Vibration (FIV), Acoustic Induced Vibration (AIV), and Flow Induced Pulsation (FIP) in accordance with Energy Institute Guidelines to avoid v...
What Is Transient Analysis?
You're tasked to perform a transient analysis of a piping system and it would be really helpful if there was a good software tool out there to help you. Well, you've come to the right place because AFT has great solutions! ...

Know Your Pump & System Curves - Part 3
In the final "Know Your Pump & System Curves" blog series, I am going to discuss the complexities behind pump vs. system curves for systems with pumps in series and parallel configurations. Multiple pumps in series configurations are relatively s...

Digital Twin – Identical or Fraternal?
When I was a child, I was jealous of twins. I thought how cool it would be to have a twin. I had twin cousins a few years older than I was that I saw on a frequent basis. I always got them confused. Which one was Roger, and which one was Ronny? A buz...
Introducing Applied Flow Technology |
Fluid transportation is an integral part of today's society. AFT software products have emerged as world leaders in helping engineers move fluids more safely and efficiently. There are countless examples of this. We have chosen four such stories to help engineers understand how our products can help them solve problems and improve their engineering designs and operations. We developed a video to tell this story. Watch it here!
6365 Hits
The demand for our AFT Impulse waterhammer modeling software and associated training seminars has been growing steeply in recent years. I frequently travel internationally to teach seminars on waterhammer. When I do I make it a point to find out what the engineer's local language calls waterhammer.
6424 Hits
Relief valves can be modeled in four different configurations with AFT products and they are shown in the figure below. The required inputs for modeling a relief valve are the valve type, cracking pressure, valve loss model, and the exit pressure in the case of relieving to the atmosphere. There are three types of relief models available: Internal (Cases 1 & 1a), Relief Valve at Exit (Case 2), and Inline Exit (Case 3). In cases 1 and 1a, the relief valve is relieving into vent piping downstream of the valve. Note that there is initially no flow in the pipe downstream...
12432 Hits
In 2010 the Walt Disney Company created a mind-boggling new night time show called World of Color at the Disney California Adventure theme park which is part of Disneyland Resort in Anaheim, California. For anyone who ever doubted that flow can be fun, you need to see this show!
5667 Hits
AFT Fathom 8 began shipping last week. And we are excited. The release of AFT Fathom 8 coincided with the unveiling of our new logo, new website and newly branded material. It is not an understatement to say this represents a new era for AFT.
4873 Hits
We at Applied Flow Technology are really excited about the new version of AFT Fathom 8 coming in September. Once our customers get their hands on it we are confident they will be equally excited. This version represents the most significant upgrade since AFT Fathom 4 was released in year 2000. It will further establish AFT Fathom as the world's leading pipe flow modeling tool.The prices are increasing soon so if you are planning to order new AFT Fathom licenses or SUM annual support do not delay. Read further for more details.The effort to move AFT Fathom from version 7 to 8 turned...
10104 Hits
Many times when modeling heat transfer using heat exchangers in AFT Fathom, significant temperature differences across the heat exchanger can have a major impact on the accuracy of the heat transfer results. This can especially become a problem with non-linear heat capacity relationships. The heat transfer across the heat exchanger in the model below is calculated from the temperature difference across the heat exchanger and the arithmetic average heat capacity. One way to enhance the accuracy of the heat transfer results is to model the single heat exchanger junction, J2, as multiple heat exchangers as shown in the below model. The...
6746 Hits