AFT Blog
Inherent vs. Installed Control Valve Curves and How They Relate to AFT Software
As tech support engineers, we sometimes receive questions from users confused about what control valve characteristic curve (inherent or installed) they are inputting into AFT Fathom, AFT Arrow, or AFT Impulse.
The inherent control valve characteristic curve plots the valve open percent versus the percent of maximum Cv. This curve is true regardless of the system effects on the valve.
The installed control valve characteristic curve plots the valve open percent versus the flow through the valve, and this plot is dependent on the conditions specific to the system. For example, if the control valve flow setpoint is fixed at 250 gpm, the pressure drop required by the control valve to achieve that flow rate will be related to the other sources of pressure drop (and pressure addition) that exist in the system. If there is almost no pressure drop in the system, the control valve will need to add the majority of the pressure drop in order to achieve the specified flow, so its open percentage will need to be much smaller than if there were several other sources of pressure drop.
Let’s investigate how AFT software handles control valve modeling when open percentages are specified. Note that it is the Cv that dictates the system hydraulics, so an open percentage is “Optional” information the user can enter into AFT Fathom. Entering this information allows the Output to display the open percentage of the valve. Look at the simple model below:
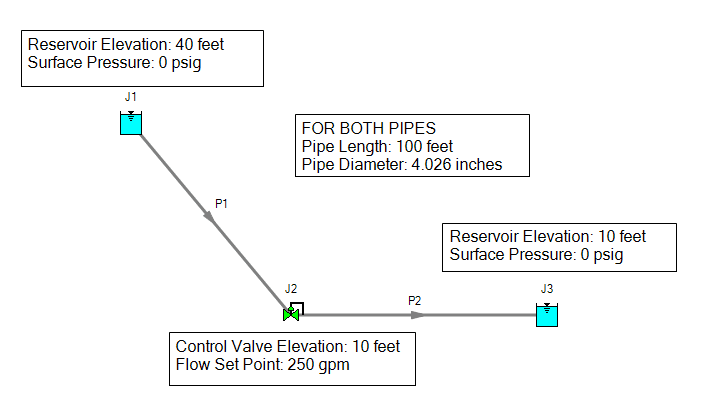
The control valve in Figure 1 is set to control the flow to 250 gpm. The open percentage, entered on the Optional tab, is shown in Figure 2., along with the resulting Open Percent vs. Cv graph.
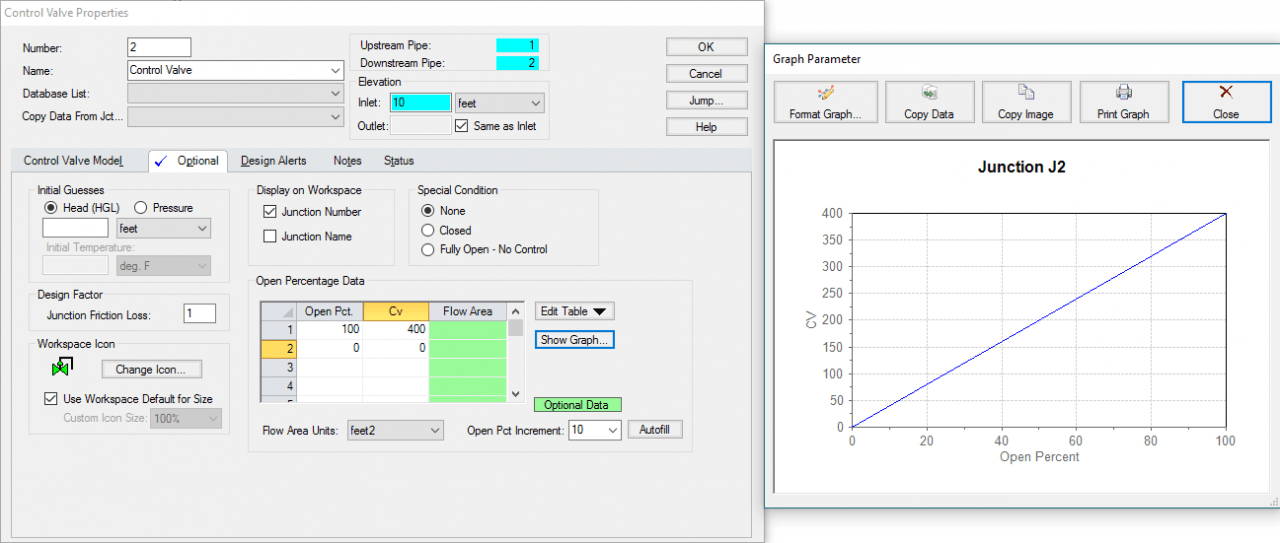
Note that this open percent vs. Cv graph is the inherent characteristic curve, and that this curve is not system dependent. The Cv required to achieve the specified flow, as well as the open percent, is reported in the Output window (see Figure 3).

So…where does the installed characteristic curve come into play?
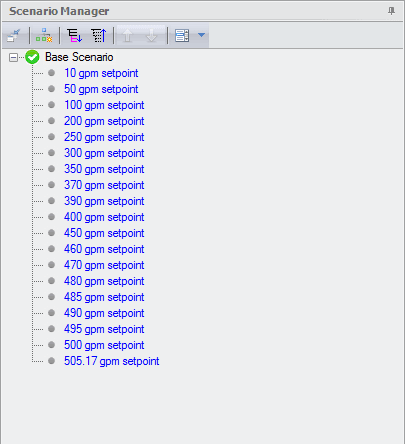
Because the installed characteristic curve is dependent on the layout of the system itself, AFT software can help you determine what the control valve’s installed characteristic curve will look like once your system is modeled. To develop the installed characteristic curve, you can use the Scenario Manager to create scenarios in which the control valve’s set point is changed incrementally. This was done in Figure 4. Once all of the scenarios are created, you can use the Batch Run feature to quickly run all scenarios, and the Multi-Scenario Output feature (shown in Figure 5) to view the various control valve open percentages all at once.
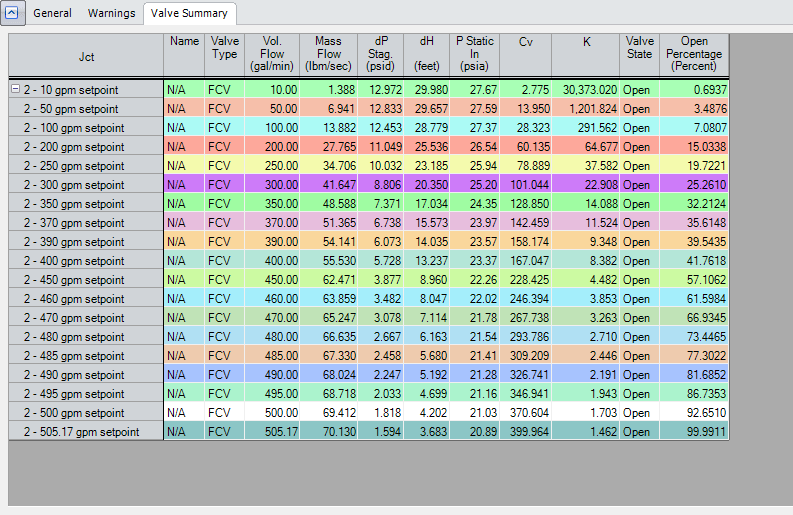
Ultimately, you can plot the values in a spreadsheet. For the model used in this example, see the installed characteristic curve plotted below in Figure 6.
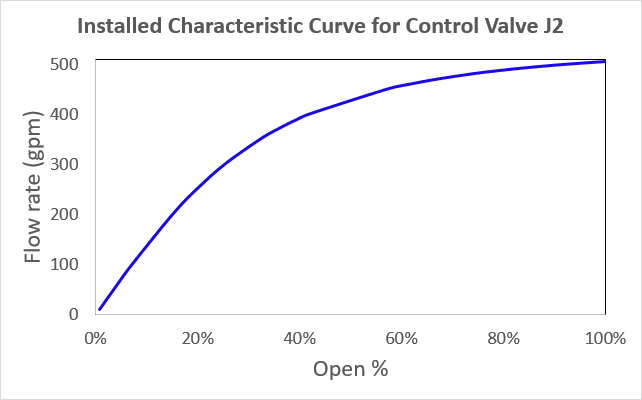
The installed curve gives the engineer a better understanding of how the flow will vary when the control valve is installed in the system, and there are several types of inherent characteristic curves that an engineer can choose from in order to get achieve the desired hydraulics in the system. Engineering toolbox describes several types of inherent characteristic curves here.
Gain analysis is frequently used to determine what type of inherent characteristic curve would best fit the system. In terms of flow control valves, if the change in flow as it is related to the change in control valve percent open (or gain) is too low, then a change in valve position will not effect a sufficiently large change. If the gain is too high, then too large of a flow change will occur, and the valve is likely to chatter. In both cases, the desired flow control is difficult if not impossible to achieve.
As a general rule, in systems with a large amount of other sources of pressure drop, equal percentage inherent characteristic valves are desirable.
Inherent and installed control valve characteristic curves go hand-in-hand. While inherent characteristic curves are necessary to describe a valve regardless of the system it is installed in, installed characteristic curves are absolutely vital to understand the effects of a given control valve in the system. AFT software allows users to input the inherent control valve characteristic curve to develop the installed characteristic curve according to the system modeled. If you are interested in seeing for yourself how AFT software can help with modeling control valves (and much, much more).



Comments