AFT Blog
AFT Arrow 6 is Gassed Up and Ready to Go!
AFT Arrow 6 was released yesterday. As usual, we have lots of cool new features to help our customers be more productive than ever.
Let's start with my favorite my new feature. Well, actually it is a collection of new features - all related to graphing.
New Graphing Features
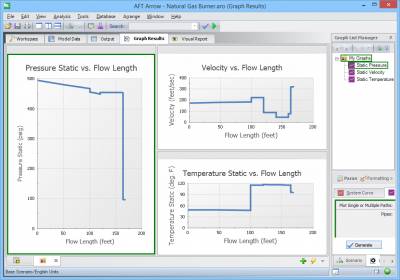
First, AFT Arrow now has the ability to display multiple graphs simultaneously. For example, see screen show below.
Second, AFT Arrow can remember all the graphs in a new Graph List Manager. This replaces and expands the previous graph retention feature which was called graph sets.
Third, graph generation capability has been added to the Quick Access Panel.
And finally, there are numerous smaller new features related to graph analysis and reporting.
Results Diagrams
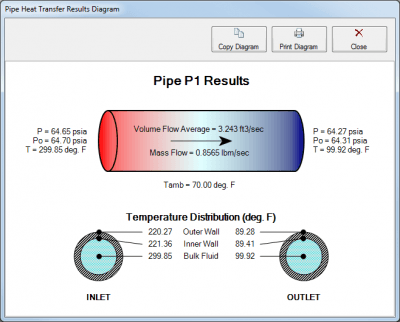
My second favorite new feature is Results Diagrams for pipe heat transfer and compressor/fans. A pipe heat transfer results diagram quickly shows temperatures for the fluid, pipe wall and insulation along a pipe. See screen shot below.
Axial Points Output Table
Finally, my third favorite new feature is the expanded Output window report for pipe Axial Points. This replaces the former Internal Results output table. Now all pipe intermediate axial point calculations are shown in a tree-view-like format, with expandable/collapsible features.
AFT Arrow remains the most powerful compressible pipe flow modeling tool on the market - and it has been since it was first released twenty years ago. AFT Arrow 6 builds on this legacy of excellence.


Comments