


AFT Blog
Welcome to the Applied Flow Technology Blog where you will find the latest news and training on how to use AFT Fathom, AFT Arrow, AFT Impulse, AFT xStream and other AFT software products.
6 minutes reading time
(1157 words)
New Feature Highlight - Scenario Comparison Tool
With new versions of Fathom, Arrow, and Impulse being released, we've been taking time to highlight some of the new features that have been added in. Recently, we've looked at multi-scenario pump vs. system curves, along with more general overview of our new features. In this blog, we'll look at one of my favorites, the new Scenario Comparison tool.
Have you ever inherited a model from a coworker, or returned to a model after a few months and struggled to understand what was changed with each scenario in the model? Or maybe, if you're like me, you left notes that made sense when you wrote them, but are unintelligible now. The new Scenario Comparison tool changes that. This tool helps users create a detailed analysis to compare almost any model parameter across any combination of scenarios in the model. Let's look at how it works.
Accessing the Tool
There are 3 main ways to get into the tool
- From the workspace directly to comparison grid
- From the Scenario Manager in the Quick Access Panel to either the comparison set up or grid
- From the Tools menu to either the comparison set up or grid
The Scenario Comparison tool has two main parts, the Scenario Comparison – Selection window, where you build the comparison, and the Scenario Comparison – Comparison Grid, where you view the comparison. Let's take a closer look at building and viewing a comparison.
Building a Comparison
With any data analysis, the most important step is telling the tool how to analyze your data. The Scenario Comparison tool is no different.
The easiest way to build your comparison is directly from the workspace or the Quick Access Panel. In the workspace, select pipes or junctions, right click, and choose Compare Scenarios. This will generate a comparison for the objects and scenarios selected. In the Quick Access Panel, right click on a scenario other than the active scenario, and choose Compare to Active Scenario. This will generate a comparison for all objects in the model between the selected and active scenarios.
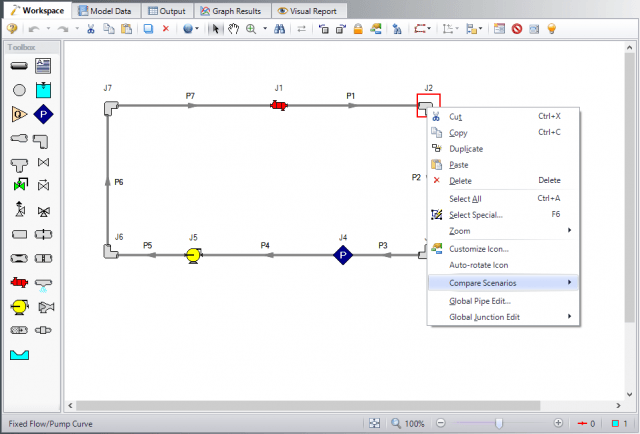
Figure 1: Generate a comparison directly from an object in the Workspace.
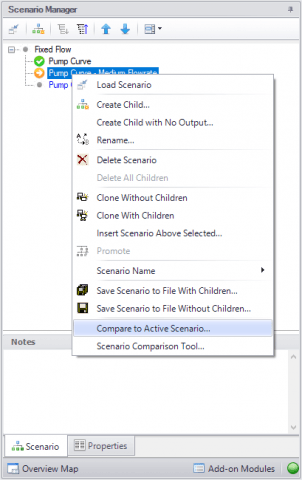
Figure 2: Generate a comparison directly from the Scenario Manager in the Quick Access Panel.
To customize your comparison further, open the Scenario Comparison tool from the Tools menu or by right clicking in the Workspace or Quick Access Panel. These actions will bring you to the Scenario Comparison – Selection window, shown below.
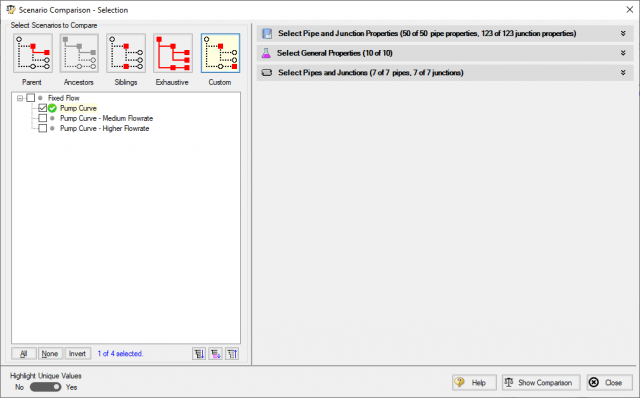
Figure 3: Scenario Comparison - Selection window with default selections shown.
On the left side of the window, you can select the scenarios that will make up the comparison using one of the three settings based on the active scenario, creating an exhaustive scenario, or by setting up a custom group of scenarios to compare.
On the right side of the window, you can select which parameters you want to be a part of your comparison. By default, the comparison is set to examine all parameters for all objects in the active scenario, along with settings for system properties and solution control. If your main objective is to understand what all is different between two scenarios, it's usually helpful to let the comparison look at everything. You can always hide information that doesn't change between scenarios in the Comparison Grid view.
For some uses, you might want to see what pump curves are being used across different scenarios, or what diameter piping is being used in different points in the model. Here, you may want to show information for a limited number of objects and parameters.
As can be seen in Figure 4 below, many of the same tools available for selecting objects and parameters in the workspace are available here. In the Properties list, you can choose to only display properties listed in the Model Data window. In the Pipes and Junctions list, you can use the same Select Special tool used elsewhere in the software to select objects based on their inputs, outputs, special statuses, and much more.
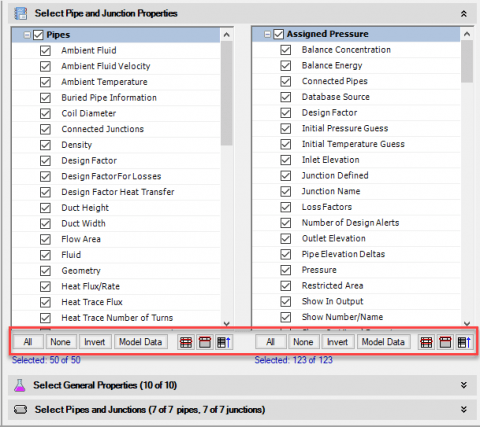
Figure 4: Selection tools available to use for Pipe and Junction Properties.
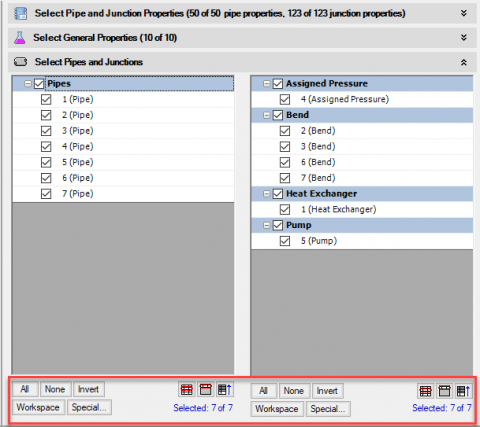
Figure 5: Selection tools available for Pipes and Junctions.
Once you have configured your desired comparison, click the Show Comparison button to view the model inputs.
Examining a Comparison
Clicking the Show Comparison button from the Scenario Comparison – Selection window brings you to the Scenario Comparison – Comparison Grid window. The options discussed previously that bring you directly to a comparison will also bring you to this window.
In the comparison grid, the default display will only show you items and parameters that are different between the scenarios being compared. This view will look something like Figure 6 below. The toggle buttons at the top of the Item and Parameter columns allow you to further configure this view.
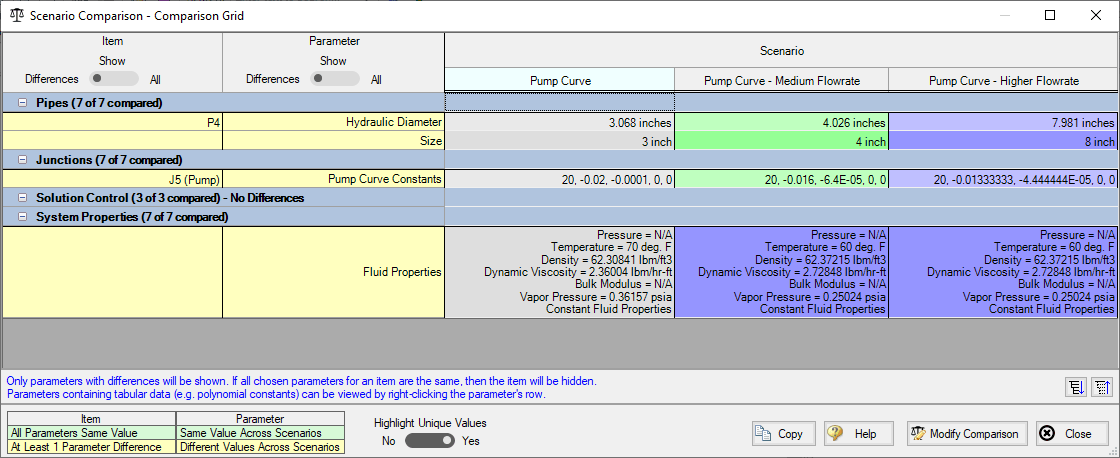
Figure 6: Default view of the Comparison Grid.
The Items toggle will show or hide items added to your comparison that have no differences between scenarios, while the Parameters toggle will show or hide parameters for given items with no differences.
The final way to change your view of the comparison grid is the toggle near the bottom of the window reading "Highlight Unique Values". As the name implies, this toggle will give visual ques in the comparison grid to help you better grasp where values are different. In the example shown in Figure 6 above, we can see that Pipe P4 has a different size across all three scenarios, so it has three different colors visible.
Many model inputs for AFT software are graphical, or curve fit data. The comparison grid lets you compare that data graphically across scenarios as well. Figure 7 below shows how anywhere you see curve fit information in the comparison grid, right click that data to see those graphs for all scenarios in the comparison.
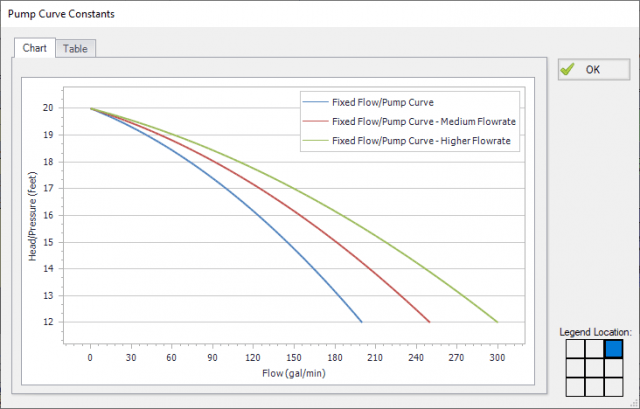
Figure 7: Graphical comparison of the curves used in Pump J5 across the thee different scenarios.
As we've seen in this blog, the scenario comparison tool can dramatically improve your ability to manage scenarios, and to work in models that might have been made by someone else. No more guessing which scenarios have which pump configurations. No more moving back and forth between scenarios trying to figure out why their results are different. The scenario comparison tool can help you efficiently find all those differences.
Keep an eye out while using the tool for added comparison features in the future. Model inputs such as Design Alerts, module-specific inputs, fluid database information and more are all on the list to be included with future versions!
Comments