


AFT Blog
Welcome to the Applied Flow Technology Blog where you will find the latest news and training on how to use AFT Fathom, AFT Arrow, AFT Impulse, AFT xStream and other AFT software products.
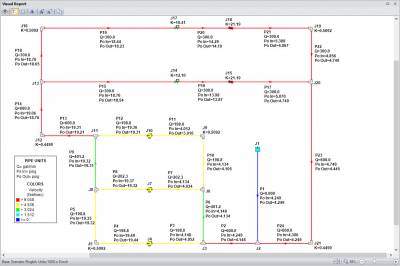
Each AFT software product employs five Primary Window tabs in which you would build, define, and analyze the model of your system. Of these, the Visual Report window is incredibly useful in that you are able to overlay your model input or output parameters directly on top of the graphical layout of the system itself. This is an excellent feature to use when you want to provide the bottom line results to clients and colleagues at a high level (or a detailed level). Figure 1 is an example of what the Visual Report for a particular system might look like. As...
7806 Hits
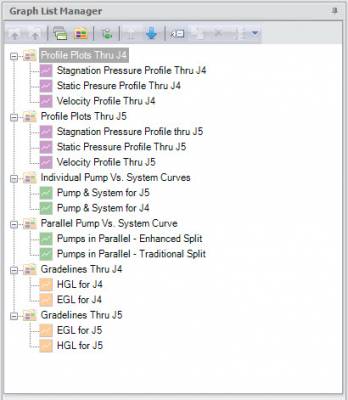
AFT software products have had powerful graphing capabilities for a very long time. Many types of graphs can be created with AFT products such as pump vs. system curves, profile plots along a flow path, gradelines and elevation profiles, transient plots (with AFT Impulse or the AFT Fathom XTS module), slurry system curves (with AFT Fathom SSL or AFT Impulse SSL modules), and selected solutions that allow you to plot various output parameters for desired pipes. All of these graphing capabilities are incredibly important to engineers as they analyze the hydraulic behavior of their system. The ability to customize the graphs...
5085 Hits