AFT Software is jam packed with options that allow Users to customize their hydraulic modeling experiences. Of which, are the many ways to use the data tables when viewing text based inputs and conveying results. But sometimes the defaults, for example in AFT Fathom, are not identical to how you elect to report your results. In this blog I will show you how to increase the number of significant figures in your data tables.
As mentioned earlier, data tables are found in the Model Data Window as well as the Output Window. These text based interfaces contain cells much like spreadsheet software but are visually limited to a finite number of digits. As such, values that exceed that number of digits may change form into scientific notation or will round up. Don’t let this alarm you as the number of digits present in all of the calculations are still being kept and recorded into your Output File. The table however, is set to only display so much information. To increase your table’s resolution, you only need to follow a few steps.
To illustrate the steps taken to vary these settings I created the model below. As can be seen in the annotation, the flow rate has a large number of significant digits. This model is deliberately simple.
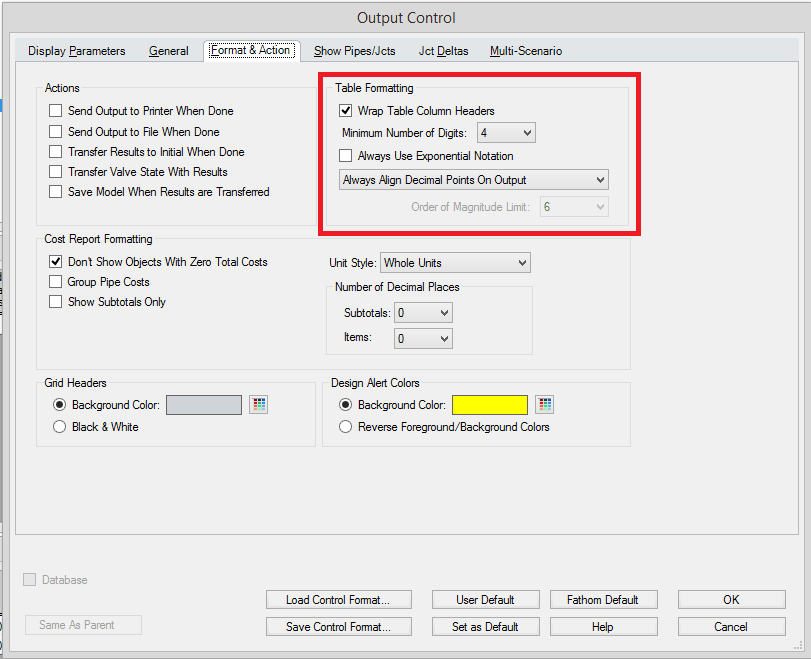
The AFT Fathom defaults for digits displayed in a table are shown below in the Output Control Window. The Output Control Window Is available from the Tools Menu.
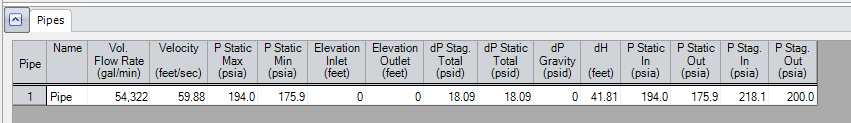
Running the model, the following results are shown below using the AFT Fathom Defaults. Compare the volumetric flowrate to the set point given in the annotation.
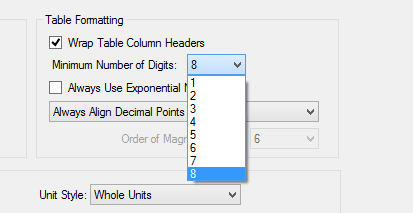
After changing the settings to the highest minimum number of digits, eight, a higher resolution was given. This value can be decreased if you find all of this information is not as meaningful to your analysis.
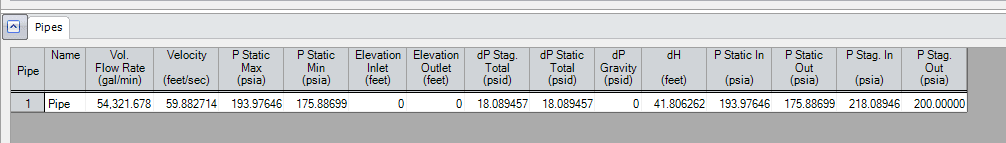
Illustrated below, the increase in resolution has taken place and the table now reflects more precise values.
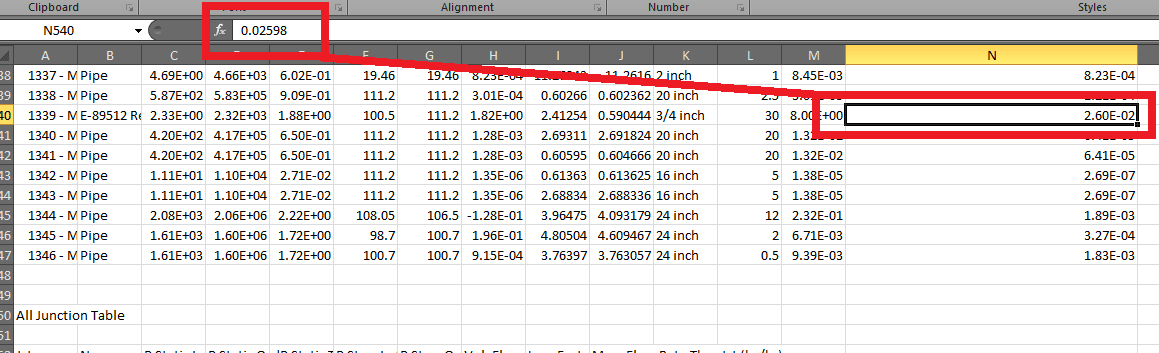
But again, these settings do not have any impact on the actual calculations as the data is still kept no matter how the values are reported in your table. This can be proven by taking a look at Excel with data copied from AFT Fathom. Shown in this image, one can see that clicking on the specific cell reports the more precise value even though that is not what is displayed.
Many of our Users take advantage of the ease in copying a table from the Output Window or the Model Data Window by selecting the top Left cell of any table and copying this into their clipboard. It is as simple as pasting the data to get these values into Excel.
Make sure to follow these steps in the Visual Report Window as well if your reporting settings are not matching your preferences. Features like this are everywhere in AFT Software and can save time and make the experience more personal when modeling. If you have any questions you can check out our support center or sign up for our User Forum and post your discussions to be answered by our knowledgeable Technical Support Staff